Figure 3.
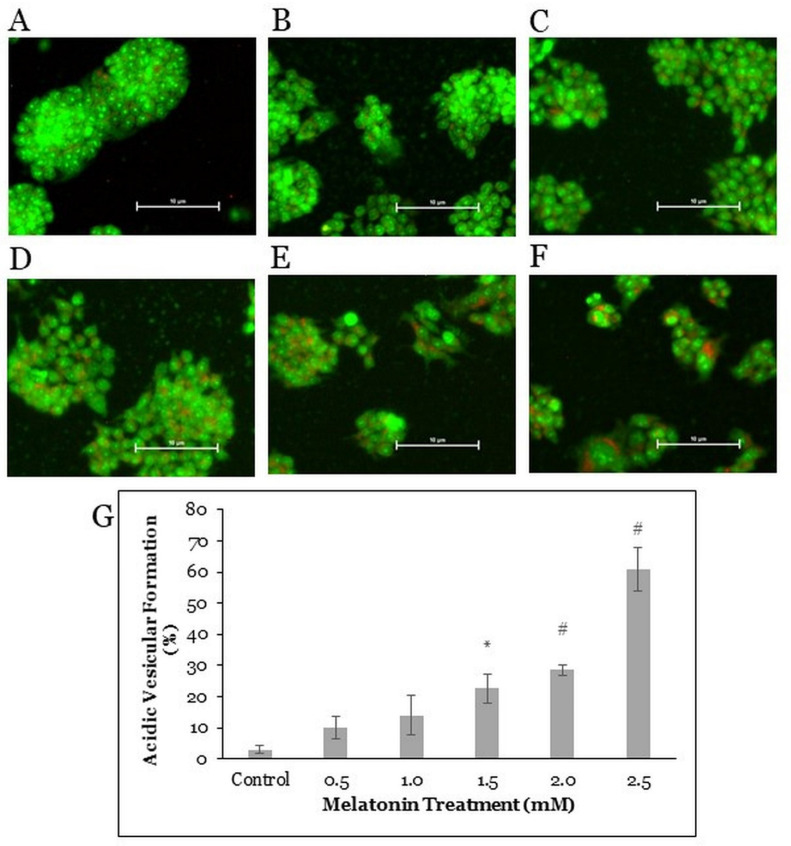
Acridine orange fluorescent staining in HT-29 cells. The HT-29 cells were treated with various concentrations of melatonin for 72 h: (A) control, (B) 0.5 mM, (C) 1.0 mM, (D) 1.5 mM, (E) 2.0 mM, and (F) 2.5 mM. Cells were stained with 5 μg/mL of the acridine orange dye for 20 min, then visualized under a fluorescence microscope with 200× magnification. (G) The bar graph represents the means ± SEM of three separate experiments. One-way ANOVA, followed by Dunnett’s post hoc test, was performed to compare each treatment group with the control. Statistically significantly different from control: *, p < 0.05; #, p < 0.01.

