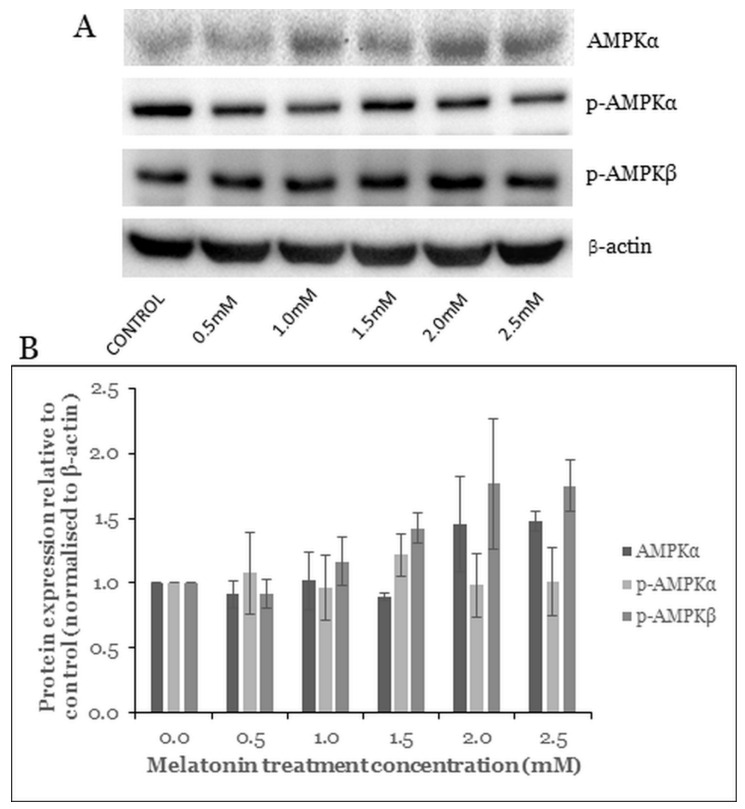
Figure 5.
Western blot analysis of the AMPK pathway in HT-29 cells after treated with various concentrations of melatonin for 72 h. (A) Expression levels of AMPK proteins were assessed by western blot analysis. (B) Bar chart of the protein expressions; each bar represents a mean ± SEM of three independent experiments. One-way ANOVA, followed by Dunnett’s post hoc test, was performed to compare each treatment group with control.

