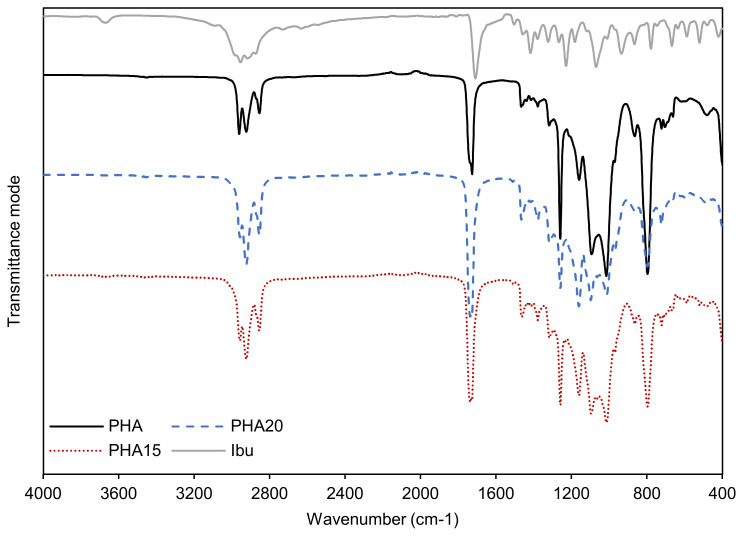
Figure 1.
ATR-FTIR spectra of mcl-PHA original sample (PHA, black full line) compared to the mcl-PHA sample impregnated with ibuprofen at 20 MPa (PHA20, blue dashed line) and the sample impregnated at 15 MPa (PHA15, red dotted line). The spectrum for ibuprofen (Ibu, grey full line) is also represented. The spectra were obtained in the region of 4000 to 400 cm−1, in transmittance mode.

