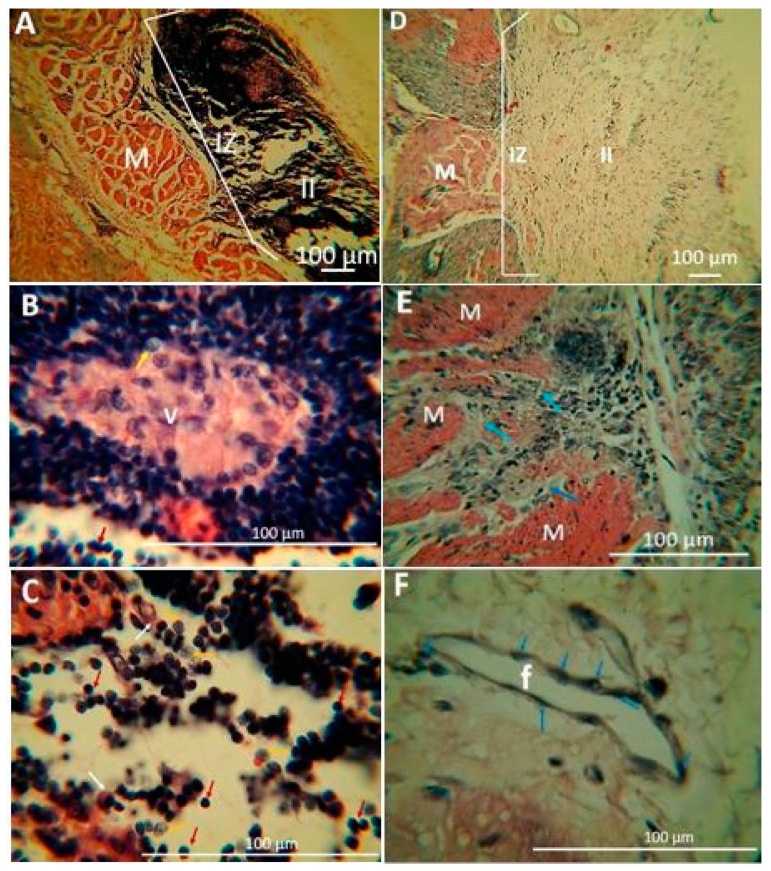
Figure 9.
Nanocomposite F3 implanted in the subdermal area of Wistar rats at 30 and 90 days. (A–C) correspond to the nanocomposites after 30 days of implantation. (D–F) correspond to the nanocomposites after 90 days of implantation. (A) at 10×. (B) at 100×. (C) at 100×. (D) at 10×. (E) at 40× and (F) at 100×. IZ. Implantation area. M: Muscle. II: Inflammatory infiltrate. V: Blood vessel. Yellow arrows: implanted material. White arrow: Plasmocyte. Blue arrow: Histiocytes. Red arrow: Lymphocyte. f: Fiber. Hematoxylin–Eosin Technique (H&E).

