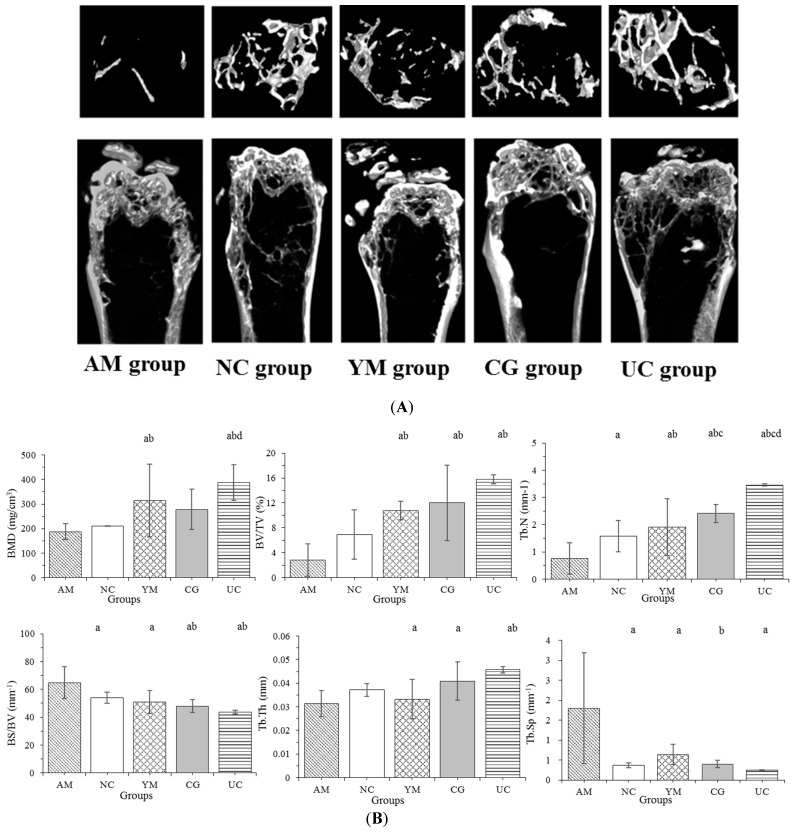
Figure 2.
The histomorphometry of the femur in the five groups. (A) The images of the changes in bone microarchitecture. (B) The mineral density and histomorphometry of the femur. The data are expressed as the means ± SD (n = 5 in the AM group, n = 7 in the YM, CG, NC, and UC groups); a p < 0.05 versus the AM group, b p < 0.05 versus the NC group, c p < 0.05 versus the YM group, d p < 0.05 versus the CG group.

