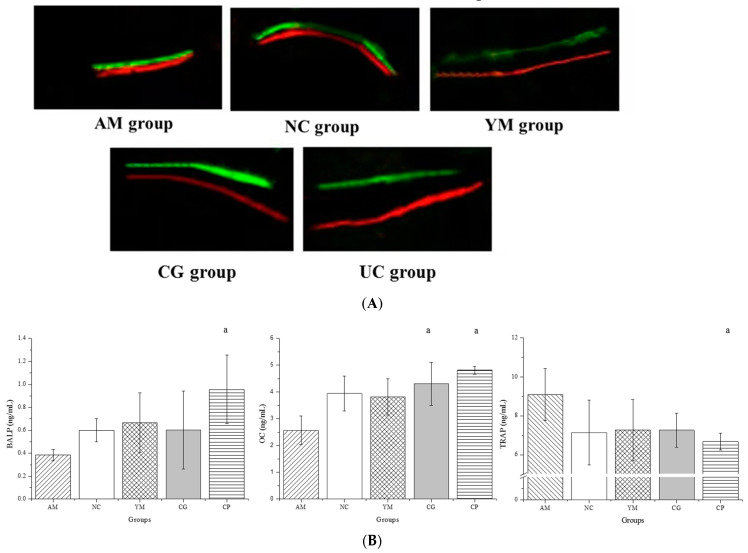
Figure 3.
Dynamic histomorphometric and biochemical markers of bone turnover analyses. (A) Dynamic histomorphometric analyses of representative fluorescence images (n = 5); (B) serum levels of biochemical markers of bone turnover (n = 5, 7, 9, 9, and 10 in the AM, CG, UC, NC, and YM groups); a p < 0.05 versus the AM group.

