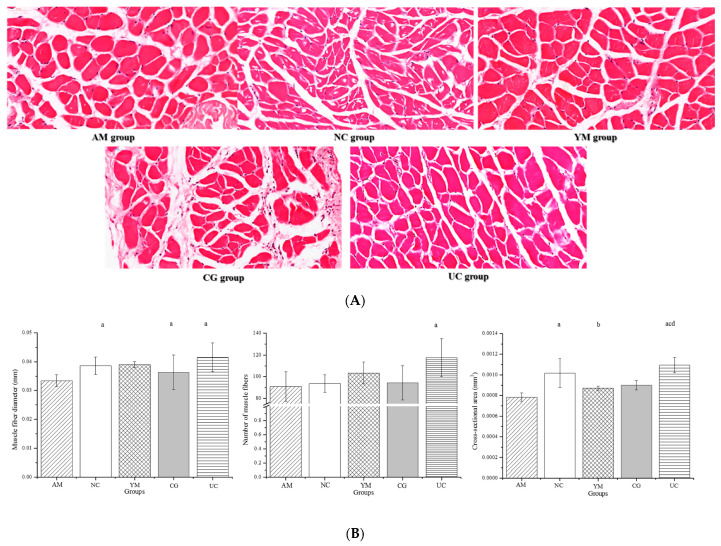
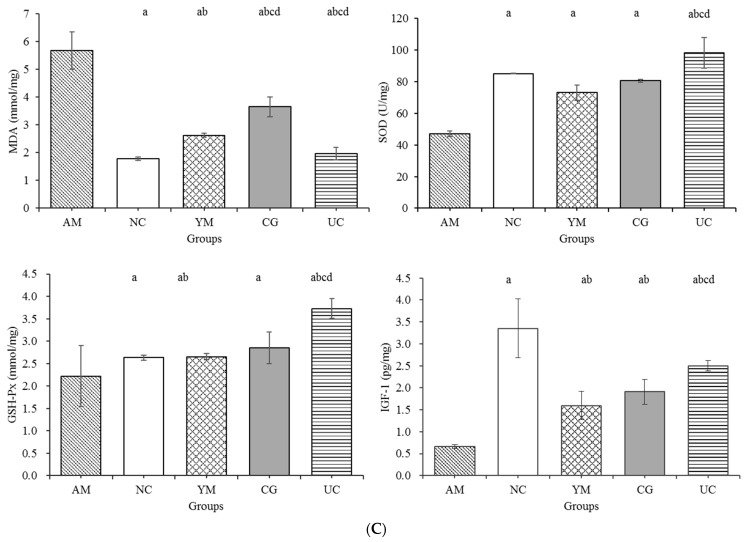
Figure 5.
H&E staining of the gastrocnemius muscle and its characteristic parameter. (A) H&E staining of the gastrocnemius. The bar indicates 50 μm. Magnification: 40×. (B) Diameter, number, and cross-sectional area of muscle fibers. (C) Biomarkers including oxidative stress and monokines IGF-1. The data are expressed as the means ± SD, n = 5; a p < 0.05 versus the AM group, b p < 0.05 versus the NC group, c p < 0.05 versus the YM group, d p < 0.05 versus the CG group.


