Figure 2.
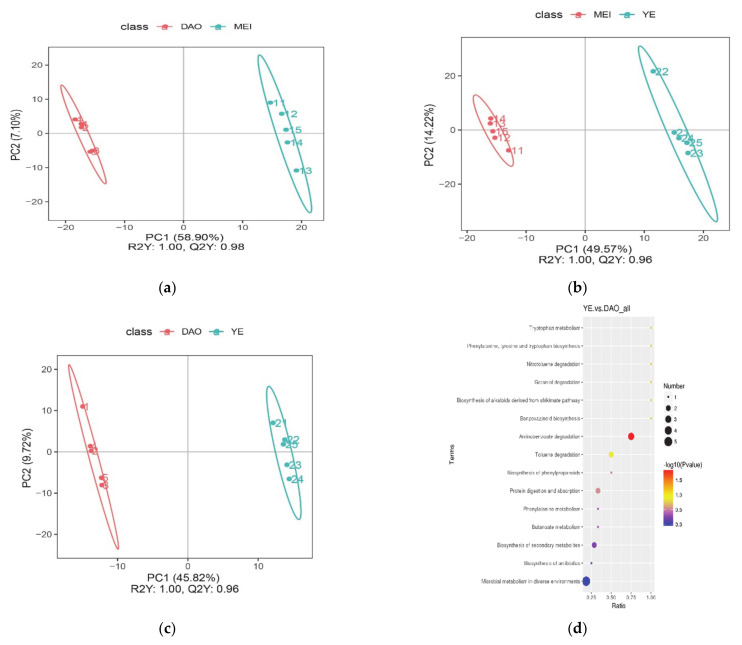
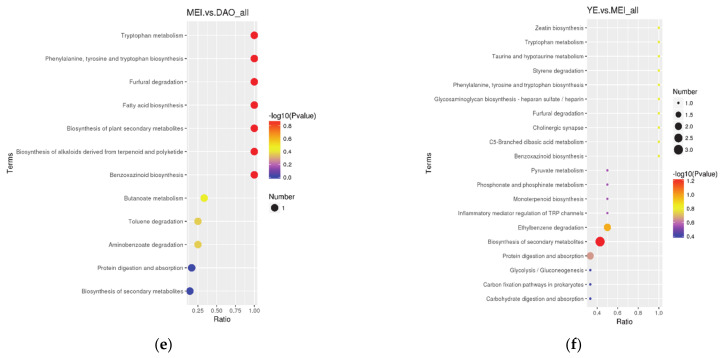
The VOC metabolic variation in aromatic rice varieties. (a) PLS-DA scores plot of Meixiangzhan 2 vs. Daohuaxiang 2. (b) PLS-DA scores plot of Yexiangyoulisi vs. Meixiangzhan 2. (c) PLS-DA scores plot of Yexiangyoulisi vs. Daohuaxiang 2. (d) The KEGG pathway that the significant differential metabolites take part in Yexiangyoulisi vs. Daohuaxiang 2. (e) The KEGG pathway that the significant differential metabolites take part in Meixiangzhan 2 vs. Daohuaxiang 2. (f) The KEGG pathway that the significant differential metabolites take part in Yexiangyoulisi vs. Meixiangzhan 2. In figures (d–f), the abscissa is x/y (i.e., the number of differential metabolites in the corresponding metabolic pathway divided by the total number of identified metabolites in the pathway). The higher the value on the abscissa, the higher the degree of differential metabolite enrichment in the corresponding pathway. Dot color represents the p-value of the hypergeometric test; smaller values reflect increased test reliability and greater statistical significance. The size of the dot represents the number of differential metabolites in the corresponding pathway; larger numbers indicate that more differential metabolites were identified in the corresponding pathway.


