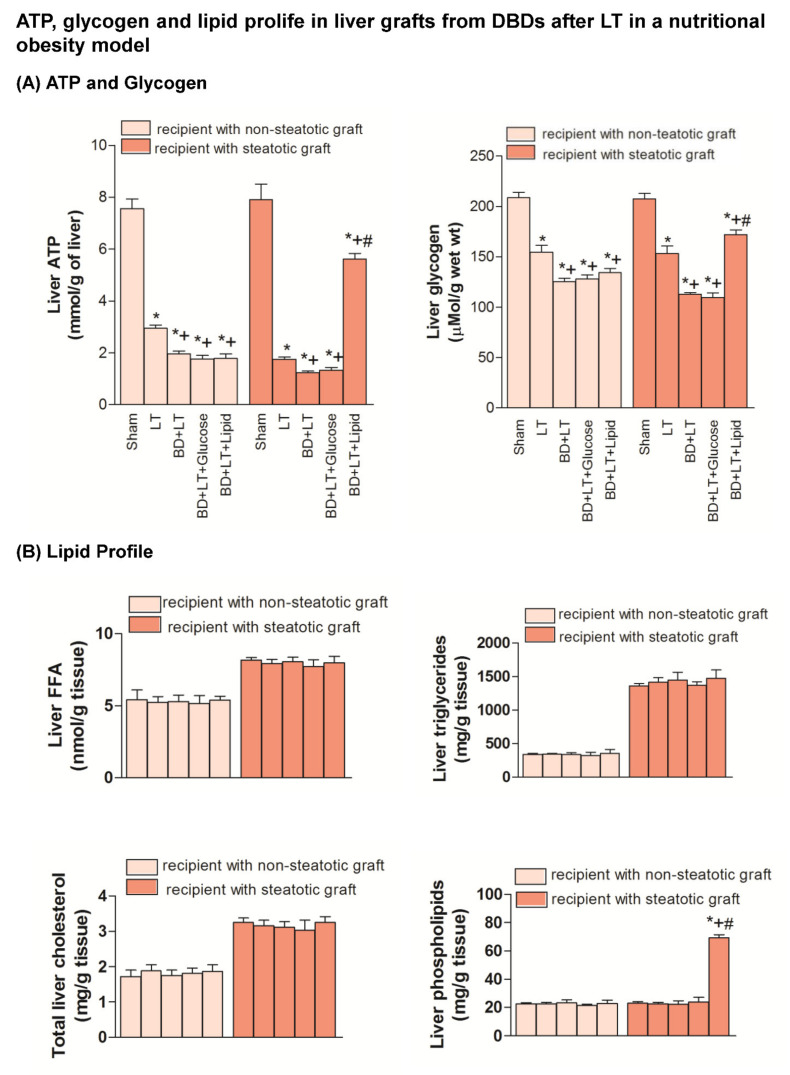
Figure 6.
Effects of glucose and lipids on ATP, glycogen and lipid profile in steatotic and non-steatotic LT in a nutritional obesity model. (A) Adenosine triphosphate (ATP) and glycogen content in liver. (B) Free fatty acids (FFA), triglycerides, total cholesterol and phospholipids in liver. * p < 0.05 vs. Sham. + p < 0.05 vs. Liver Transplantation (LT). # p < 0.05 vs. Brain Death+Liver Transplantation (BD + LT). DBD, Donors after Brain death.

