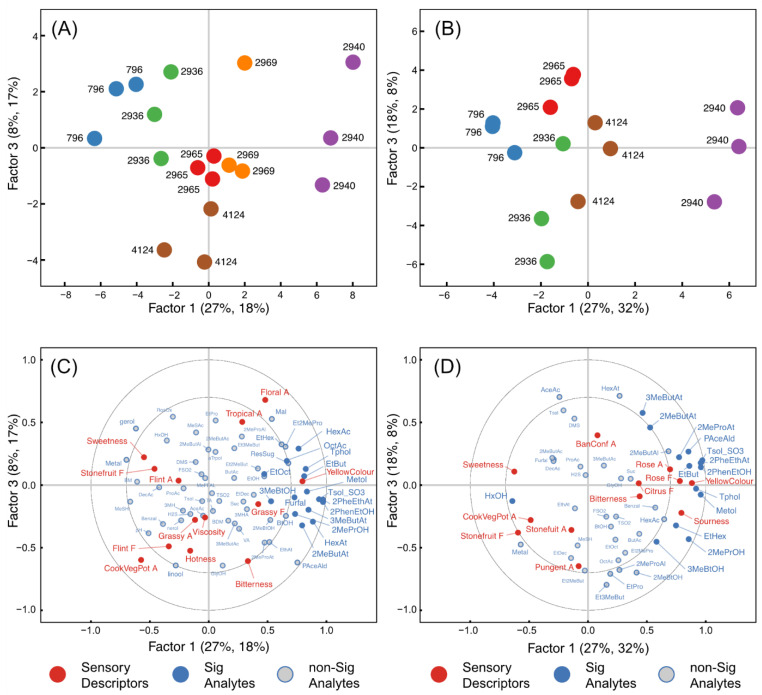
Figure 7.
Factor 1 and 3 for the scores (A,B) and loadings (C,D) plots from PLS regression models for Chardonnay wines after 3 months (A,C) and 15 months (B,D) of aging generated using important sensory attributes (Y variables, red) and com-positional compounds (X variables, blue) for each fermentation replicate of the winemaking treatments. Compounds significant to each PLS model are indicated by filled blue circles and compounds with a lesser contribution to the model are shown as open circles. The proportion of the X-variance explained by the two factors is denoted by the first value in parentheses, the proportion of Y-variance by the second value. Chemical composition and labels are summarised in Tables S10 and S11.

