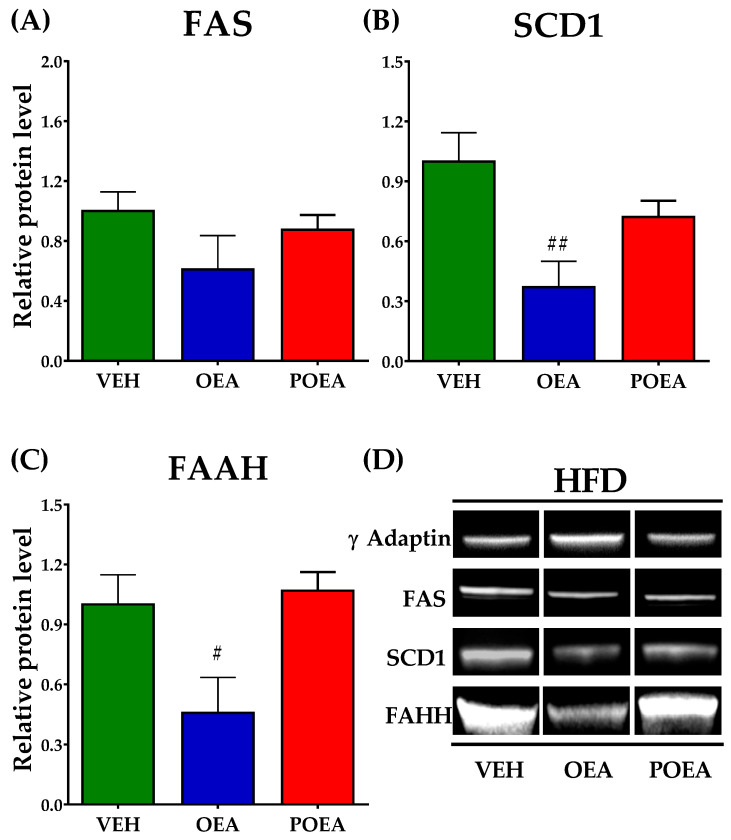
Figure 9.
Analysis of protein expression after sub-chronic (15 days) administration of a 10 mg/kg dose of either N-acylethanolamines (NAEs) degrading enzyme after sub-chronic (15 days) administration of a 10 mg/kg dose of either oleoylethanolamide (OEA) or palmitoleylethanolamide (POEA) in liver in hypercaloric cafeteria diet (HFD)-fed Sprague–Dawley rats. Fatty acid synthase (FAS) (A), stearoyl-CoA desaturase (SCD1) (B), and fatty acid amide hydrolase (FAAH) (C) were analyzed by imaging densitometry. The bars show results from six independent samples from each treatment group. (D) Representative images of Western blot analysis of liver samples for each treatment. The corresponding expression of γ-adaptin is showed as a loading control per lane. All samples were derived at the same time and processed in parallel. The bars determined the means and corrected for γ-adaptin protein as reference ± standard error of the mean (SEM) (n = 6 samples per group). Unpaired t-test: (#) p < 0.05 and (##) p < 0.01 vs. vehicle (VEH) group.

