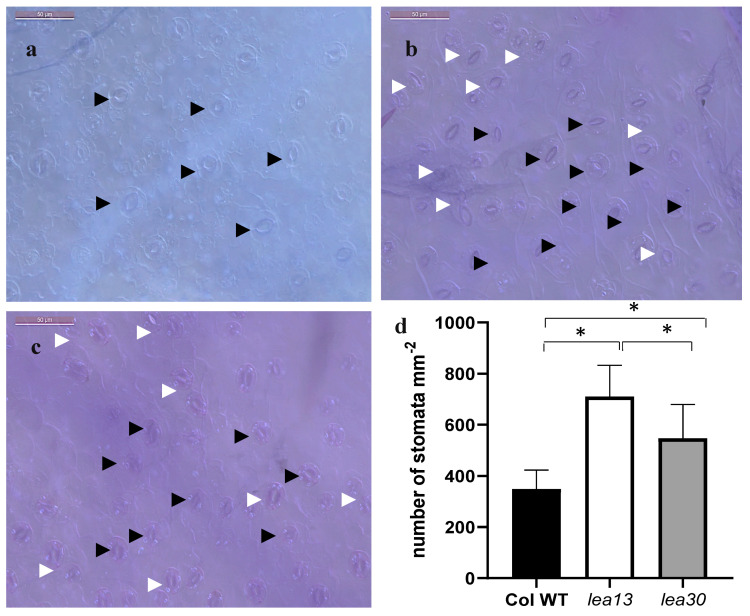
Figure 5.
Stomatal density in lea13, lea30, and wild-type plants (a–c). Adaxial sides of cotyledons. Bar, 50 μm. (a) Wild-type. (b) lea13. (c) lea30. (d) Stomatal density is shown as the average number of stomata per square millimeter. Black arrowheads point mature stomata. White arrowheads point stomata clusters. Bars indicate standard deviation. * Data represent samples Col WT and lea13 significantly different p < 0.05. ** Data represent samples Col WT and lea30 significantly different p < 0.05.

