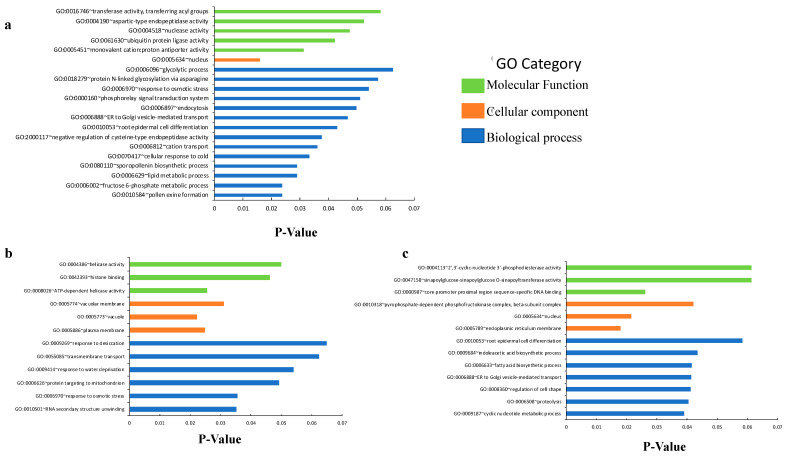
Figure 8.
Significantly enriched Gene Ontology (GO) categories (biological process, cellular component, and molecular function): (a) associated with differentially expressed genes from lea13 microarray data, (b) associated with upregulated genes from lea13 microarray data, and (c) associated with downregulated genes from lea13 microarray data. Fisher Exact p-Value = 0 represents perfect enrichment. Usually, p-Value is equal to or smaller than 0.05 to be considered strongly enriched in the annotation categories.

