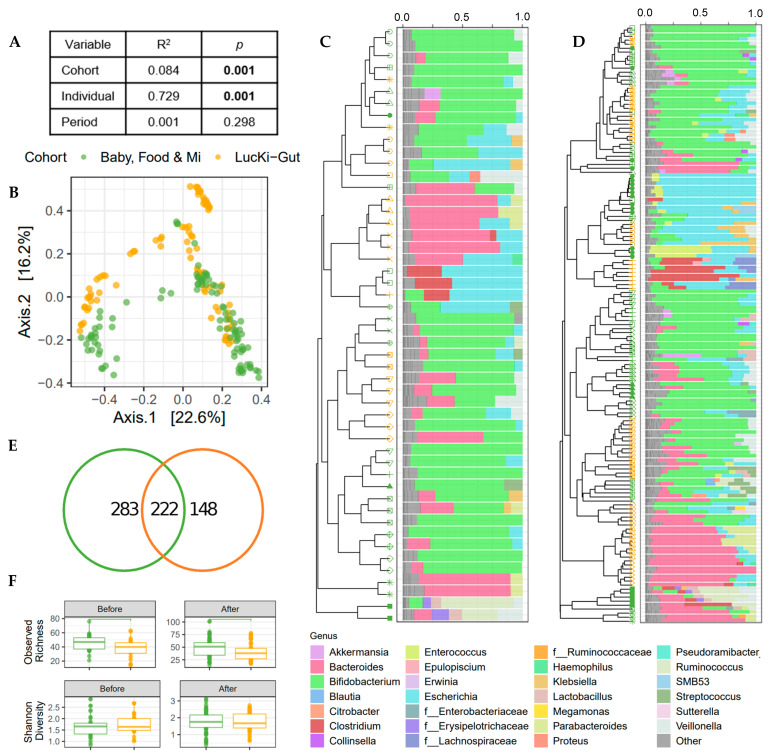
Figure 2.
Bacterial communities differ by cohort; however, greater variability is seen between individuals. (A) Explained variance (R2) and statistical significance of cohort (Baby, Food & Mi/LucKi-Gut sub-studies), individual and period (before/after solid food introduction) on the microbial community structure (Bray–Curtis dissimilarity) as determined by multivariable PERMANOVA on merged V3 data. (B) PCoA of microbial communities. (C,D) Dendrograms of UPGMA clustering of individuals by Bray–Curtis dissimilarity and relative genus abundance bar charts for each sample before the introduction of solids (C) and after the introduction of solids (D). Color of symbols indicate sub-study and shape of symbols indicate individual. Bacterial genera in “Other” include genera with a relative abundance < 5%. (E) Venn diagrams of the number of ASVs shared between the sub-studies. (F) Boxplots depicting the observed richness and Shannon diversity before and after the introduction of solid foods. For all panels green = Baby, Food & Mi, orange = LucKi-Gut.

