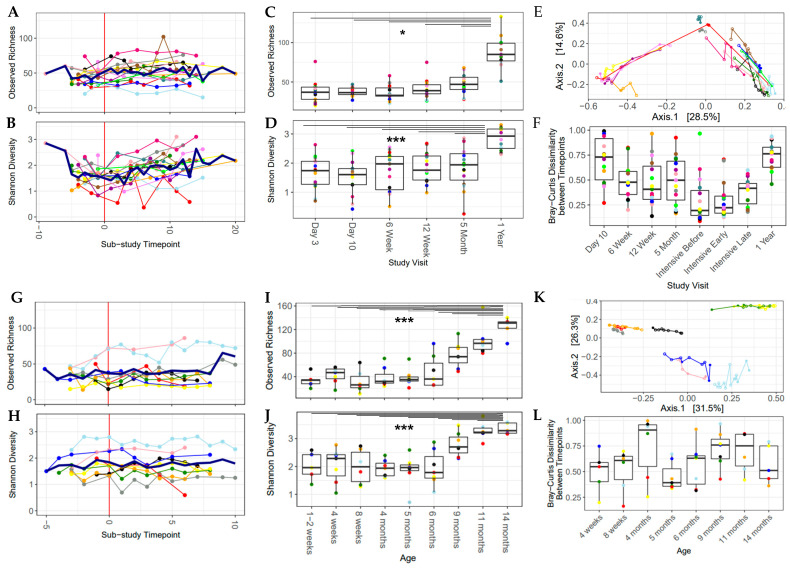
Figure 3.
Alpha diversity increased over the sub-study period and over the first year of life. Bray–Curtis dissimilarity over time shows that the gut microbial community was dynamic over the first year of life. All plots are colored by participant ID (PID). (A–F) Baby, Food & Mi sub-study; (G–L) LucKi-Gut sub-study. (A,G) Observed richness over the sub-study period, mean values are shown with a thick blue line. (B,H) Shannon diversity over the sub-study period, mean values are shown with a thick blue line. (C,I) Observed richness over the first year of life. (D,J) Shannon diversity over the first year of life. (E,K) PCoA plot of the sub-study samples. (F,L) Change in Bray–Curtis dissimilarity between each study visit and the one previous to it. (* p < 0.05, *** p < 0.001).

