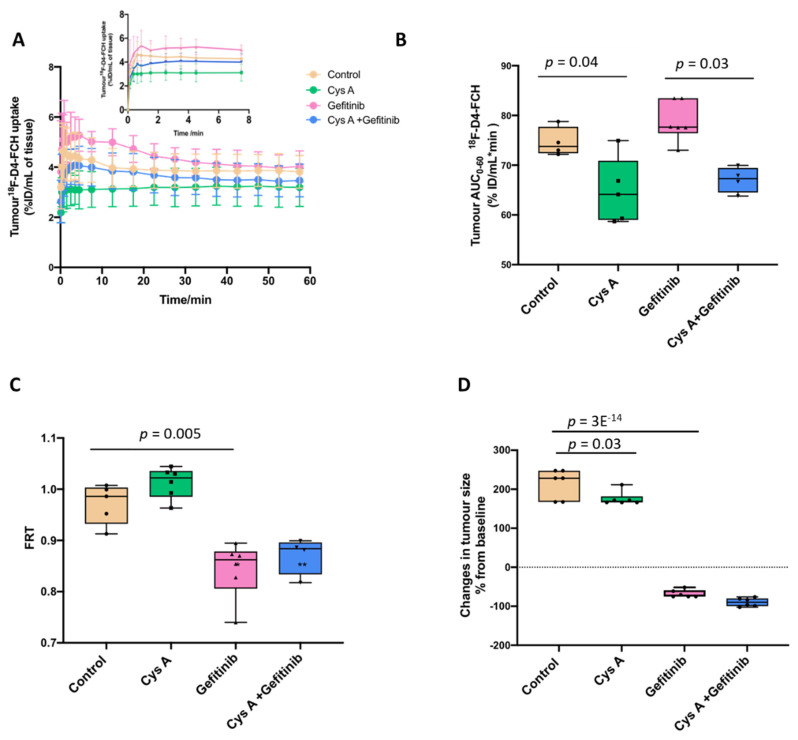
Figure 6.
The in vivo 1-h dynamic imaging of [18F]-D4-FCH in PC-9 human NSCLC xenograft-bearing mice. (A) The time versus radioactivity curves (TACs) in the vehicle control (0.4% Tween 80) or ABC transporter modulator-treated mice; inset: expanded TACs at the early time points. (B) Data from the TACs expressed as an area under the radioactivity versus TAC curves, (AUC 0 to 1 h). (C) Data from the TACs expressed as the fractional retention (FRT; NUV60/NUV3.5) across the treatment groups. (D) The tumour burden of mice (n = 24; n = 6 for each treatment) following the 20 mg/kg gefitinib treatment prior to the PET scan. The data presented are the mean ± standard deviation; the average and quartile levels are shown.

