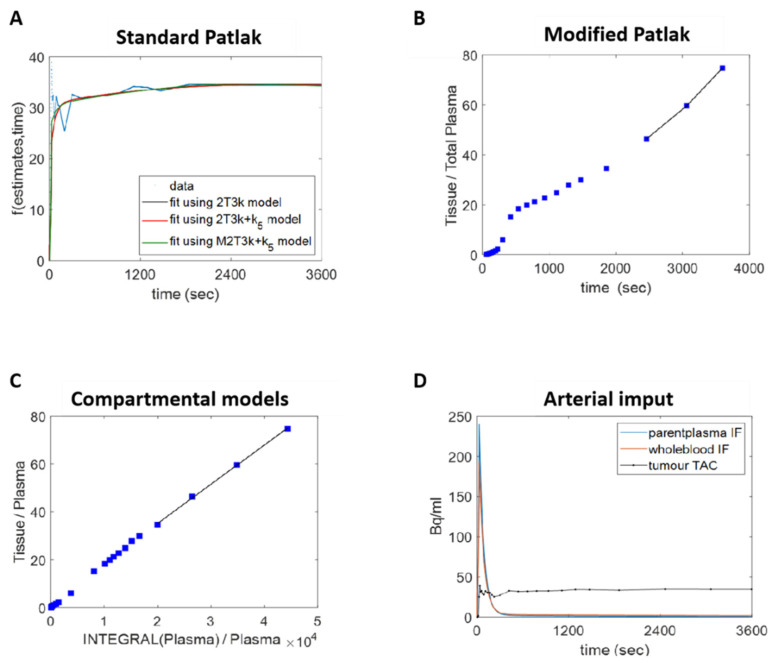
Figure 7.
Dynamic PET data quantification. (A) The standard Patlak plot assumes the presence of an irreversible compartment and a time t* after which all the reversible compartments are in equilibrium with the plasma. This method provides the irreversible uptake rate constant Ki, which is the slope of the regression line. With the same assumption of the standard one, (B) the modified Patlak plot takes into account the contribution of the metabolites to the exchangeable space within tissues and demands the use of an arterial plasma input function that is corrected for metabolites. The Ki is evaluated as before. (C) A true quantification of the tracer exchange rates between the compartments can be obtained by fitting the patient data with compartmental models. The irreversible 2 tissue 3k (2T3k), 2 tissue 3k + k5 (2T3k + k5), and the modified two-tissue 6k + k5 (M2T6k + k5) were used. (D) The kinetic analysis of the [18F]-D4-FCH PET data demands the implementation of an arterial input function.

