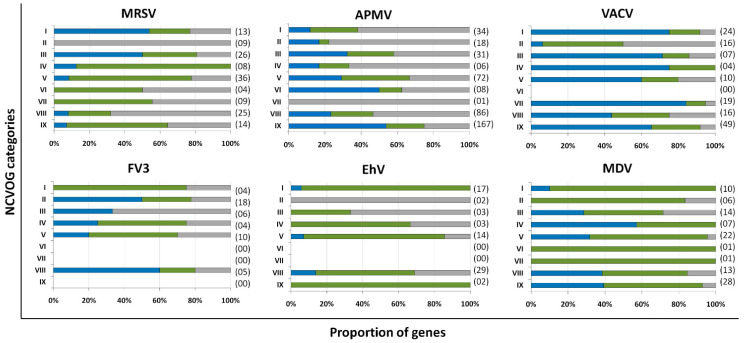
Figure 2.
Distribution of genes from different functional categories into temporal gene expression classes. The x-axes contain the different functional categories based on the NCVOG classification. The y-axes represent the proportion of genes for each functional category for all six viruses included in the analysis. Data are shown as a percentage to allow for proper comparison. The number of genes associated with each category is indicated in parenthesis. Blue, early genes; green, intermediate genes; grey, late genes. I, transcription and RNA processing; II, virion structure and morphogenesis; III, signal transduction; IV, nucleotide metabolism; V, DNA replication, recombination and repair; VI, translation; VII, host–virus interaction; VIII, other metabolic functions; IX, miscellaneous. APMV, mimivirus; MRSV, Marseillevirus; VACV, vaccinia virus; FV3, frog virus 3; EhV, Emiliania huxleyi virus 201; MDV, medusavirus. The complete data are included in Tables S2–S7.

