Figure 5.
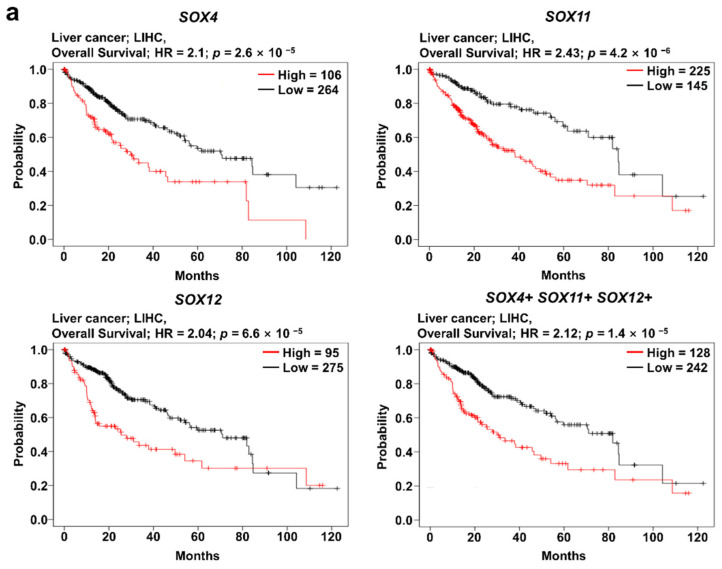
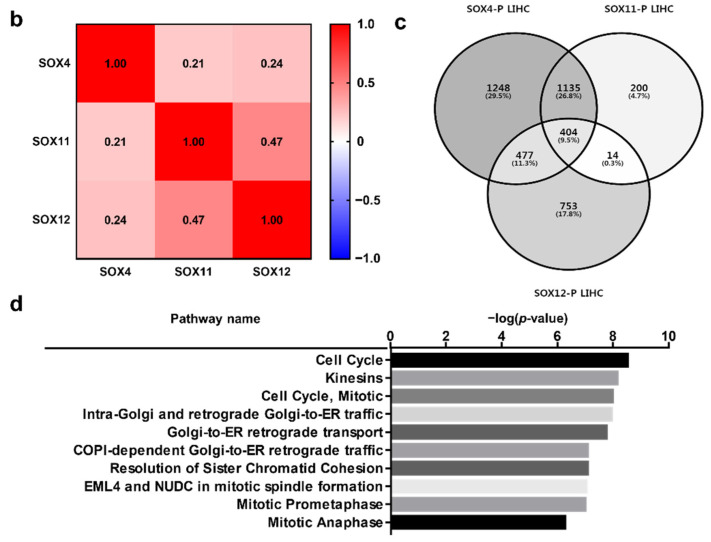
Prognostic value of co-expression of the three SOX genes in liver cancer. Correlation of SOX4, SOX11, and SOX12 expression with the prognosis of liver cancer, and analysis of commonly positively correlated genes of the three SOX genes. (a) Survival curve comparing patients with high (red) and low (black) expression of each SOX gene using the Kaplan–Meier plotter. The plotters were analyzed for liver cancer. (b) Correlation heat map of SOX4, SOX11, and SOX12 expression data, generated using TCGA-LIHC RNA sequencing data from the cBioPortal database. Pearson’s correlation was calculated among the three SOX genes to determine the co-expression pattern of genes in the heat map. (c) Venn diagram of the genes positively correlated with the three SOX genes, generated using the TCGA-LIHC transcriptome dataset from the R2 database. (d) Reactome pathway analysis of the genes positively correlated with the three SOX genes, using the TCGA-LIHC transcriptome dataset.


