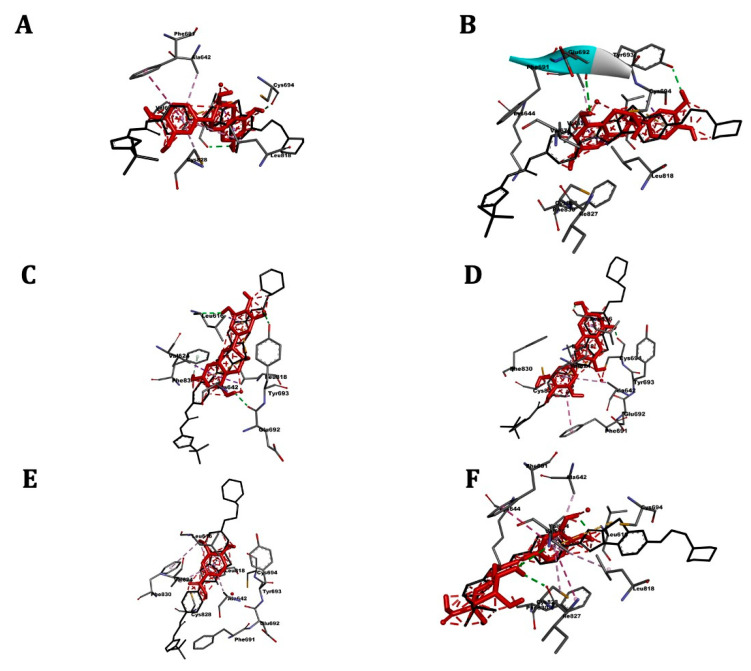
Figure 7.
3D scheme of the ligand–FLT3 receptor interactions. In red, tested molecule (A) catechin, (B) epicatechin, (C) epigallocatechin, (D) gallocatechin, (E) vanillic acid, (F) chlorogenic acid; in black, reference molecule (quizartinib) and labeled amino acid residues interacting with the tested molecule.

