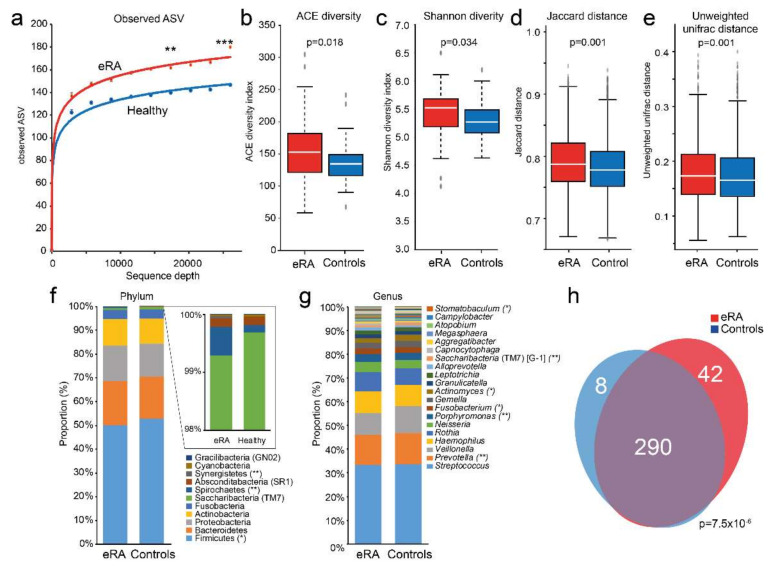
Figure 1.
Comparison of saliva microbiota diversity, (dis)similarity, evenness and shared species between early onset RA and healthy subjects. (a) Rarefaction curves for amplicon sequence variants (ASV) in early onset RA (eRA) and healthy control subjects. Box plots of (b) ACE diversity, (c) Shannon diversity, (d) Jaccard distance and (e) unweighted unifrac distance. Stacked bar graph of top 20 (f) phyla and (g) genera for eRA patients and healthy control subjects. ***, ** and * indicate <0.001, <0.01 and <0.05, respectively. (h) Venn diagram illustrating overlapping and unique species in e RA and healthy controls. A full list of detected phyla, classes, orders, families, genera and species are presented in Table S1.

