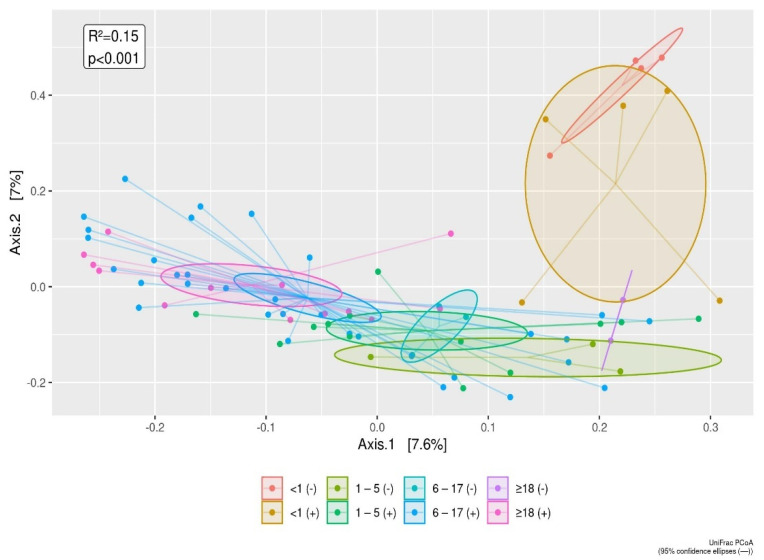
Figure 4.
The UniFrac distances between enteric pathogen positive versus enteric pathogen negative subjects is displayed by age groups, using principal coordinate analysis (PCoA). The infant group tends to separate out according to Axis 1 (7.6%) and Axis 2 component (7%). The differences of the infant group from other age groups as shown in Figure 1, are also confirmed for comparisons of enteric pathogen negative versus enteric pathogen positive subjects.

