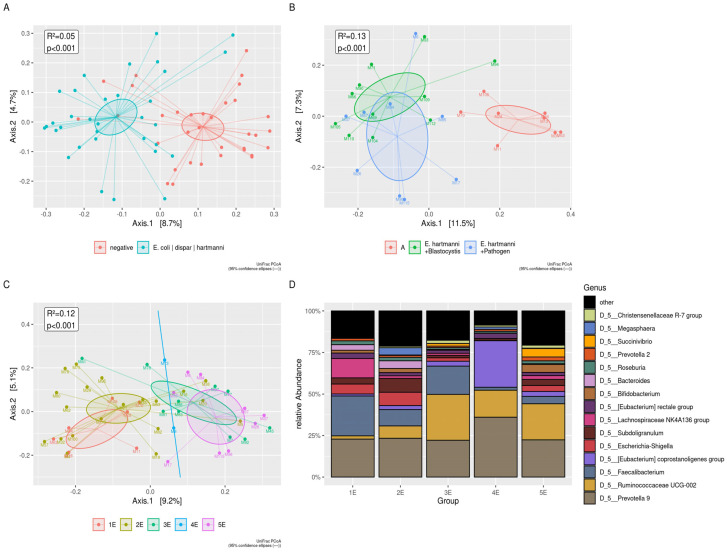
Figure 6.
Beta diversity analysis in presence of Entamoeba spp. (A) The UniFrac distances between negative and positive subjects for Entamoeba spp., using principal coordinate analysis (PCoA) (B) The UniFrac distances among negative group, subjects harboring E. hartmanni and Blastocystis, and subjects harboring E. hartmanni, Blastocystis, and other pathogens, using principal coordinate analysis (PCoA). Group 1E: control group; Group: 2E: positive for pathogens not including Entamoeba spp.; Group 3E: subjects positive for En. coli and other pathogens; Group 4E: subjects positive for E. dispar and other pathogens; Group 5E: subjects positive for E. hartmanni and other pathogens. (C) The UniFrac distances among Group 1E, 2E, 3E, 4E, and 5E using principal coordinate analysis (PCoA). The groups carrying En. coli, E. dispar, and E. hartmanni (Groups 3E, 4E, and 5E), clearly were separated from groups not harboring Entamoeba species (Groups 1E and 2E). (D) The plot of top 15 relative bacterial abundances at the genus level. All the significances relating to (A–D) are summarized in Table S5D.

