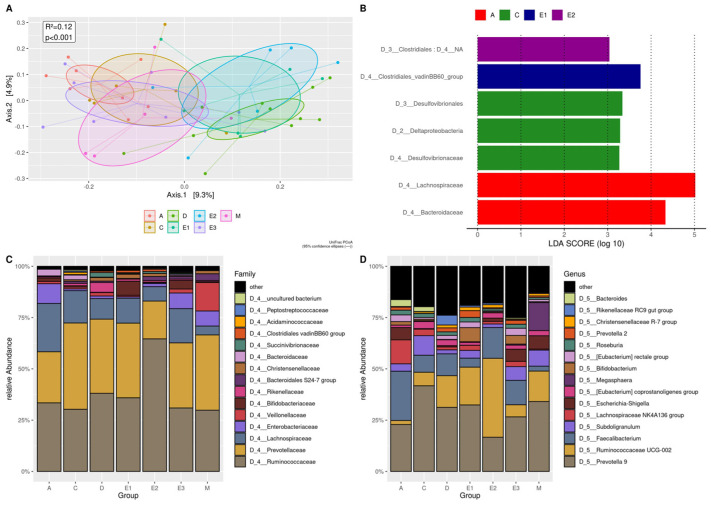
Figure 7.
Beta diversity analysis for the subjects positive for G. duodenalis and other intestinal pathogens. Groups A: control group; Groups C: positive for Blastocystis only; Groups D: positive for Blastocystis and E. hartmanni without other pathogens; Groups E1: positive for E. hartmanni, Blastocystis and G. duodenalis, and pathogenic bacteria and viruses; Groups E2: positive for En. coli, Blastocystis and G. duodenalis, and pathogenic bacteria and viruses; Groups E3: positive for Blastocystis, G. duodenalis, and pathogenic bacteria and viruses; Groups M: positive for Blastocystis and mixed infection of pathogenic bacteria and viruses, without G. duodenalis and Entamoeba spp. (A) PCoA UniFrac showing low divergences along Axis 1 (9,3%) between positives with Blastocystis and E. hartmanni without pathogens (Group D) and Groups E1 and E2 including positives for G. duodenalis and other intestinal microorganisms. (B) Histogram of the linear discriminant analysis (LDA scores indicate the higher difference between clades of A, C, E1, and E2 groups. (C) The plot of top 15 relative bacterial abundances at the family level. (D) The plot of top 15 relative bacterial abundances at the genus level.

