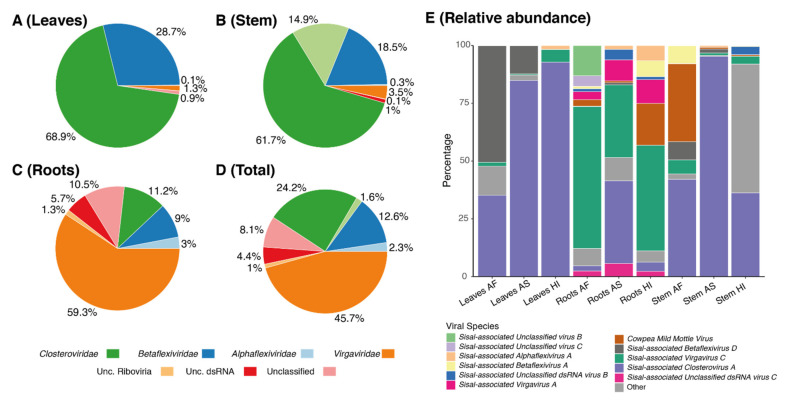
Figure 5.
Viral abundance of Agave-associated viruses by organ. Pie charts indicate viral family abundance by expression in tpm, in (A): leaves, (B): stems, (C): roots, and (D): in total. Values are summed for all plants. (E): The stacked bar plot indicates the relative abundance of the top 12 expressed viral species in each organ.

