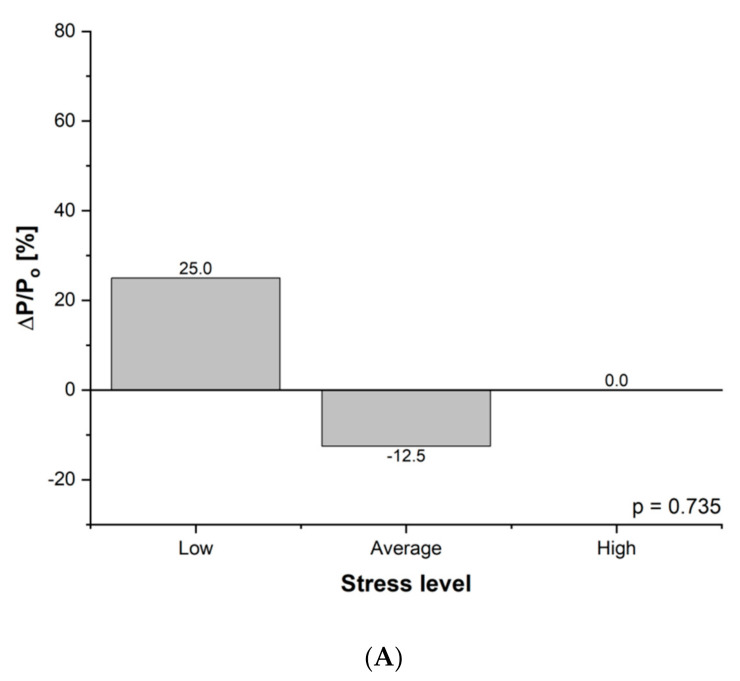
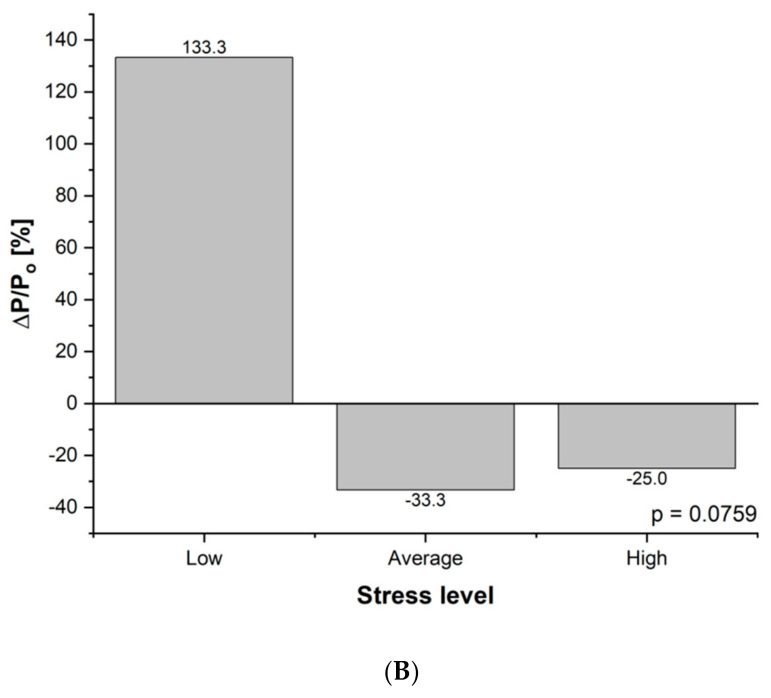
Figure 2.
(A) Difference in stress level initially and after three months of intervention in group A: P, percentage of the group; ΔP = PAfter − Pbefore; Po = Pbefore; ΔP/Po relative change of percentage of the group (during experiment). (B) Difference in stress level initially and after three months of intervention in group B: P, percentage of the group; ΔP = PAfter − Pbefore; Po = Pbefore; ΔP/Po relative change of percentage of the group (during experiment).


