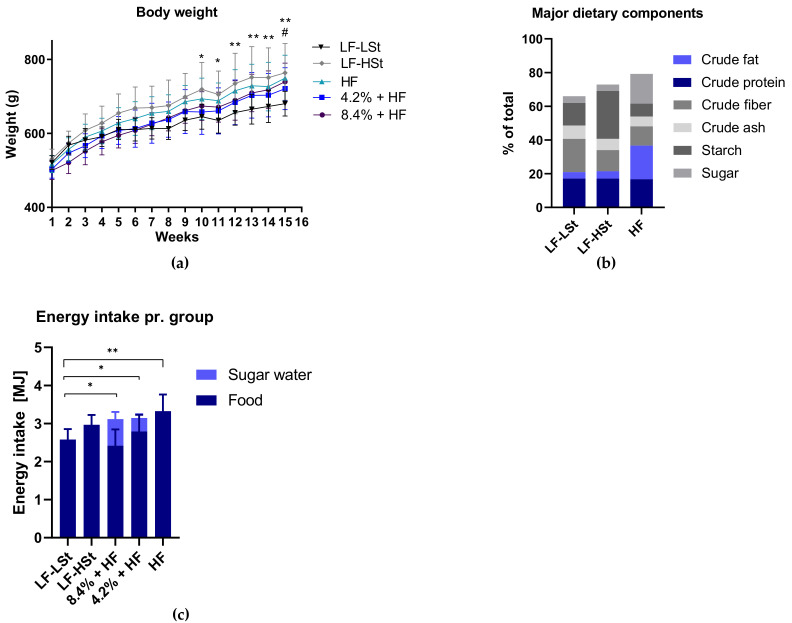
Figure 1.
Body Weight and Energy Intake. (a) Body weights for each group are presented as means with SD, for each week. Data was analyzed using a mixed effects model with repeated measures with a Tukey’s test for multiple comparisons. n = 8 (b) Major dietary components presented in % (c) Energy intake in MJ for each group is presented as means with SD and analyzed using a one-way ANOVA with a Dunnett’s test for multiple comparisons. n = 13 average weekly intake pr. group during the study period. For LF-LSt vs. LF-HSt * p < 0.05, ** p < 0.01. for LF-LSt vs. HF # p < 0.05. LF: Low Fat, HSt: High Starch, LSt: Low Starch, HF: High Fat, MJ: Mega Joule.

