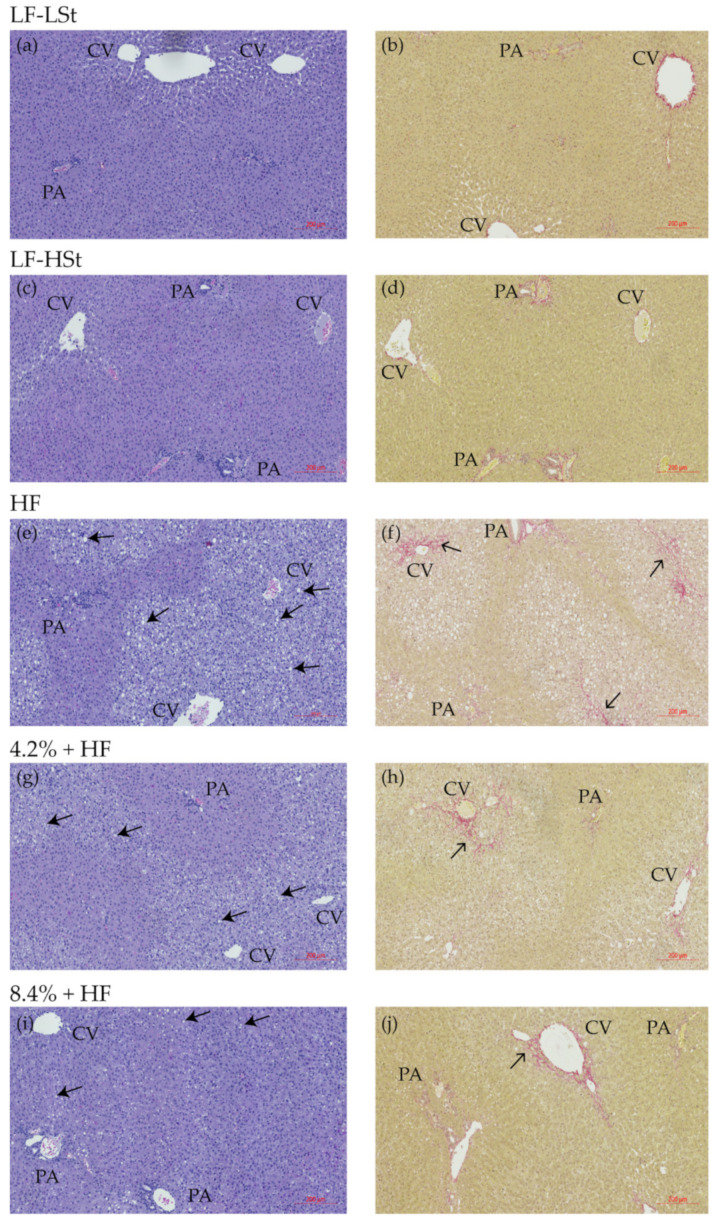
Figure 4.
Representative histological images. (a,c,e,g,i) Hematoxylin and eosin stain. Scale bar shows 200 µm. (b,d,f,h,j) Picro Sirius Red stain. Scale bar shows 200 µm. Solid arrows indicate lipid vacuoles, and open arrows indicate fibrosis (in red). CV: central vein, PA: portal area, HF: high fat, LF: low fat, HSt: high starch, LSt: low starch.

