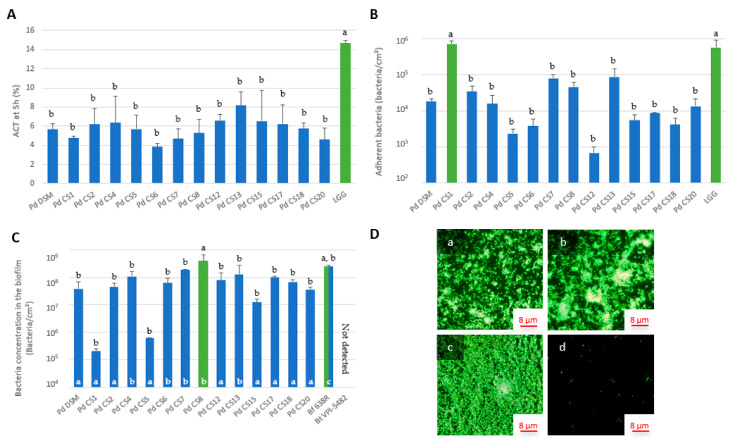
Figure 1.
(A) Homo-aggregation coefficient (ACT) of 14 strains of P. distasonis and LGG (positive control) after 5 h of incubation at 37 °C under anaerobic conditions. The colors coupled with a and b indicate the significantly different groups after ANOVA, p < 0.05. Error bars reflect standard error of the mean. (B) Adhesion capacity of 14 strains of P. distasonis and LGG (positive control) on abiotic support after 48h of incubation at 37 °C under anaerobic conditions. The colors coupled with a and b indicate the significantly different groups after ANOVA, p < 0.05. Error bars reflect standard error of the mean. (C) Biofilm formation capacity of 14 strains of P. distasonis, Bf 638R (positive control) and Bt VPI-5482 (negative control) on abiotic support after 6 days of incubation at 37 °C under anaerobic conditions. The colors coupled with black a and b indicate the significantly different groups based on ANOVA, p < 0.05. White a, b, and c indicate the biofilm organization pictures collected in (D). Error bars reflect standard error of the mean. (D) Biofilm organization on abiotic support after 6 days. (a) Organization showing small clusters of bacteria from P. distasonis CS2 biofilm; (b) Organization showing large clusters of bacteria from P. distasonis CS7 biofilm; (c) Biofilm formed by the positive control Bf 638R; (d) Scattered cells from the negative control Bt VPI-5482. All the data represent mean ± standard error or observations from at least two independent experiments performed with each strain in triplicate (n = 2 × 3).

