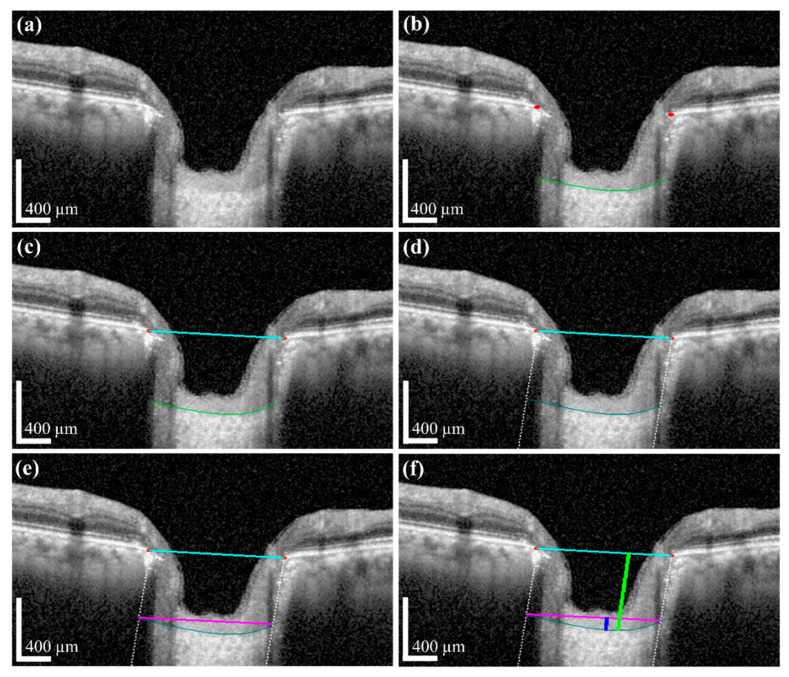
Figure 11.
Results of each image processing step for quantification: (a) Original OCT image for investigation. (b) Proposed deep learning model and post-processing are performed to obtain the LC boundary curve of the BMO points. (c) Acquired information after post-processing and two BMO points (red dots) were connected to create a BMO reference line (cyan color line). (d,e) A vertical dotted line is lowered at two BMO points, and the points meet with the two ends of the anterior LC curve (teal color curve) and create a new line to connect with the two ends of the anterior LC curve (magenta color line). (f) The line drawn perpendicular to the anterior LC curve and the BMO baseline is called LCD (lime green color line), and the straight blue color line drawn vertically between the width (w) and anterior LC curve is called LCCD. Scale bar: 400 µm.

