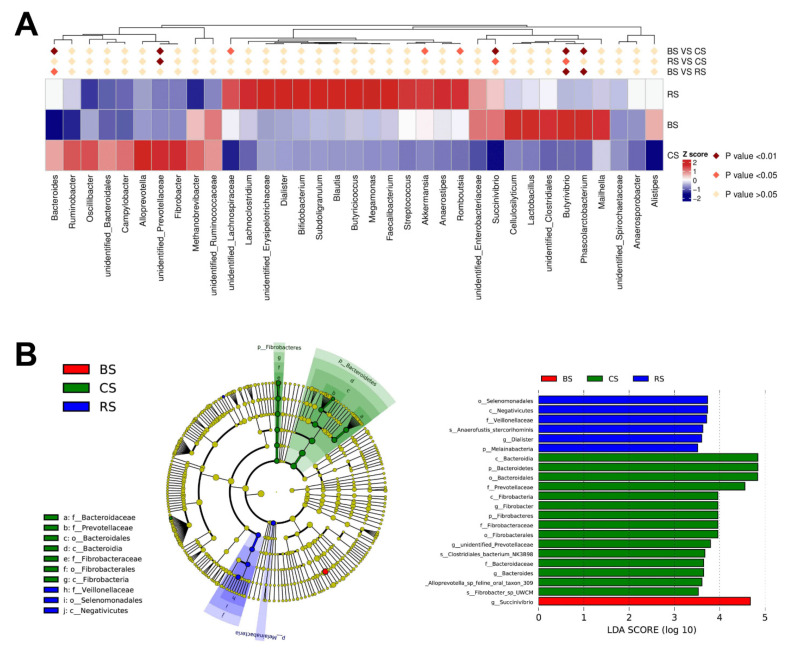
Figure 4.
Differences in microbiota abundance in the three groups: fed with basal diet (CS) basal diet with 0.3% (w/w) Bacillus amyloliquefaciens-9 (GB-9) (BS), and basal diet with 0.3% (w/w) Radix Tetrastigmae powder (RS) at week 6. (A) The heatmap of the top 35 genera. (B) The result of LEfSe. Bar plots show linear discriminant analysis (LDA) scores of each OTU. The LDA score indicates the effect size of each OTU, and OTUs with an LDA score > 3.0 are shown. Statistical analyses of the relative microbial abundance in genus level were performed using the ANOVA with the SPSS software (SPSS v.19, SPSS Inc., Chicago, IL, USA).

