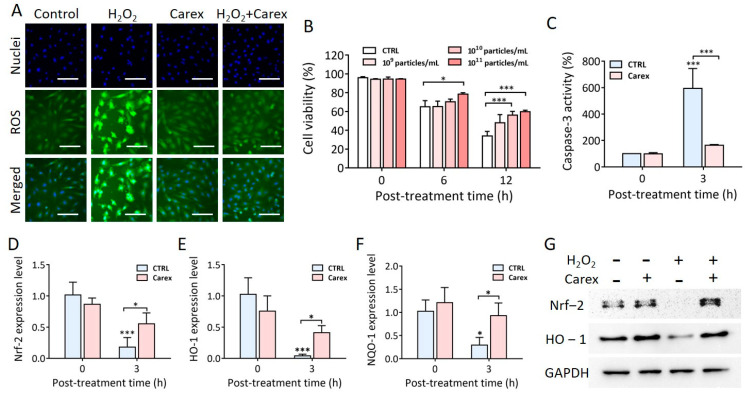
Figure 4.
Antioxidative and apoptotic effect of Carex in H9C2 cardiomyoblasts. (A) Cells were supplemented with 1 × 10¹¹ particles/mL of Carex by oxidative stress induction, using H2O2. The intracellular ROS levels (green) and nuclei (blue) were stained using H2DCFDA and Hoechst 33342, respectively, followed by fluorescence microscopic observation. The scale bars indicate 100 μm. (B) Cells were supplemented with different concentrations of Carex for 1 d followed by H2O2 treatment. Cell viability was measured by a WST-1 assay. (C) Caspase-3 inhibition in H9C2 cells by Carex. (D–F) RT-PCR analysis of Nrf-2 (D), HO-1 (E), and NQO-1 (F) mRNA expression levels. (G) Western blot analysis of Nrf-2 and HO-1 protein expression levels. GAPDH was used as an internal control. All values are expressed as mean ± SD (* p < 0.05, *** p < 0.001; n = 3).

