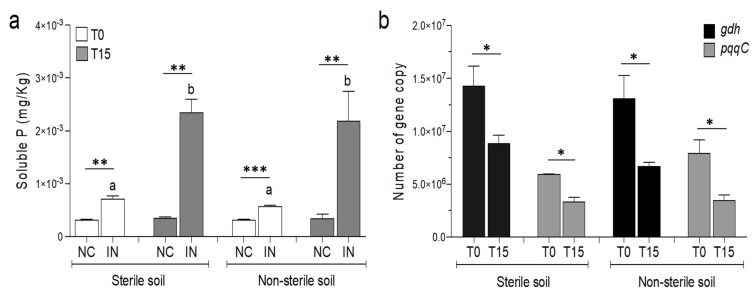
Figure 2.
(a) Soluble P in P. agglomerans inoculated sterile and non-sterile soil at 0 and 15 days. NC: uninoculated soil; IN: inoculated soil; 0: day of the inoculum; 15: 15 days after inoculation; t-student test was performed to compare NC and IN at each time and different soils; statistically significant differences are indicated with the asterisks (**, p < 0.01; ***, p < 0.001). ANOVA multi-comparison was also performed to evaluate changes in NC and IN due to the treatment; different letters indicate significant differences (p < 0.01). (b) Quantification of the gdh and pqqC genes in sterile and non-sterile soils inoculated with P. agglomerans at 0 and 15 days; t-student test was performed to compare number of genes at 0 (T0) and 15 (T15) days for each gene (*, p < 0.05).

