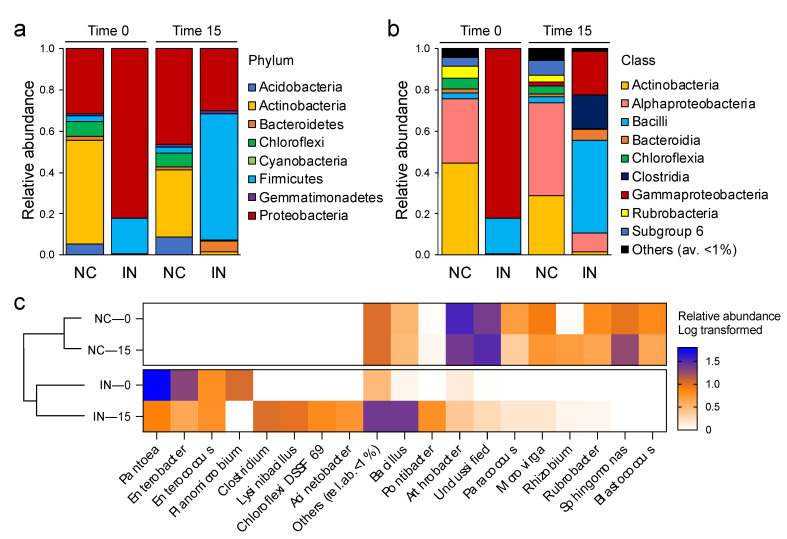
Figure 4.
Percentage of relative abundance of bacterial (a) phyla, (b) classes, and (c) genera in control (NC) and P. agglomerans inoculated (IN) soils samples at 0 and 15 days. Relative abundance of genera is reported as log-transformed. For each treatment values are expressed as the average of the three replicates.

