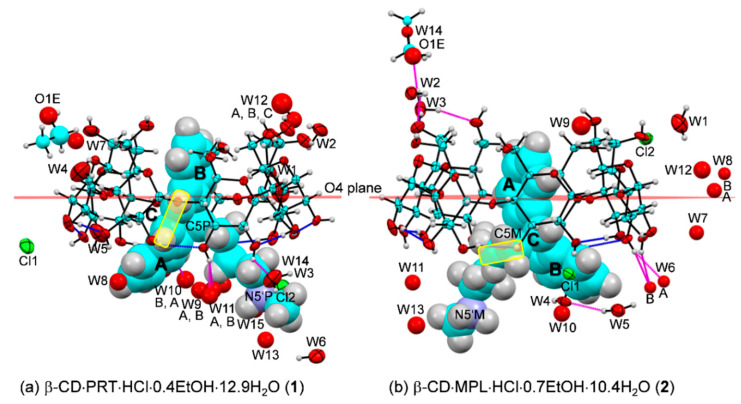
Figure 4.
β-CD inclusion complexes with (a) PRT 1 and (b) MPL 2 in the solid state at 296 K (ORTEP plots at 20% probability level). For clarity, the drug molecules are shown in the space-filling model. The O–H···O hydrogen bonds stabilizing the round β-CD and the asymmetric unit are indicated by blue and magenta connecting lines, respectively. The -CH=CH- bridge of PRT and the -CH2–CH2- flexure of MPL at the central C-ring are emphasized in yellow areas. Note the reverse inclusion modes of PRT B-ring and MPL A-ring in the β-CD cavity.

