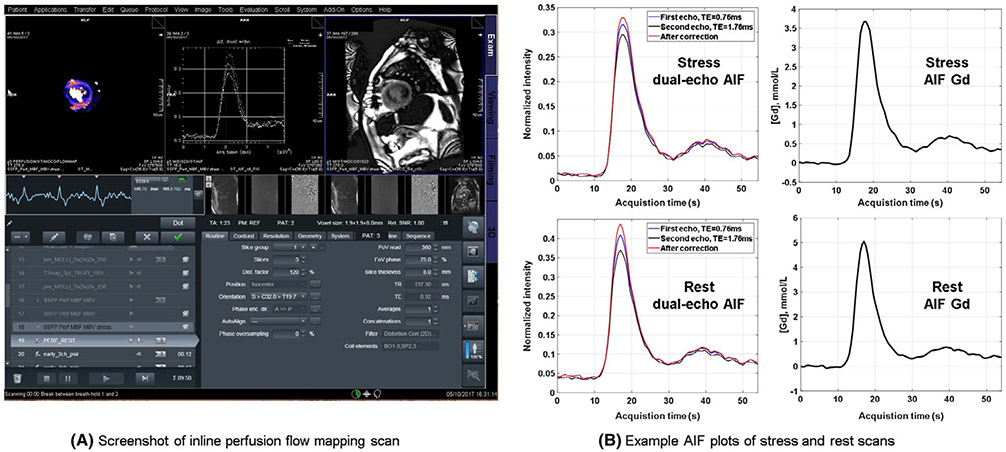
FIGURE 6.
Proposed perfusion flow mapping was integrated on the scanner. A, A screenshot of inline perfusion flow mapping scan for a patient with obstructive epicardial coronary artery disease for illustration of the method. The pixel-wise MBF map, AIF figures and perfusion MOCO images are sent back to scanner without any user interaction. B, Example AIF plots for stress and rest scans. The AIF intensity curves of dual-echo acquisition are shown as the first column. The second column is the AIF curve in Gd unit

