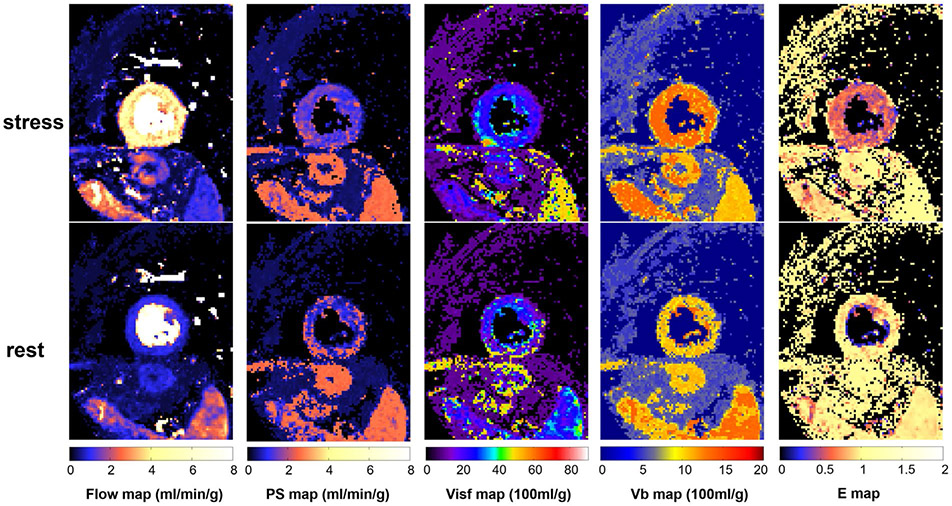
FIGURE 8.
An example of perfusion flow mapping. Pixel-wise maps for all 4 parameter and E are computed by the proposed automated workflow. The stress flow and blood volume are significantly increased compared to rest. The extraction is higher at rest and lower at stress, indicating the stress myocardium is not flow-limited. Given the ROI drawn in the myocardium, histograms of all parameters for entire cohort are given for stress and rest mapping in the Supporting Information Figure S1

