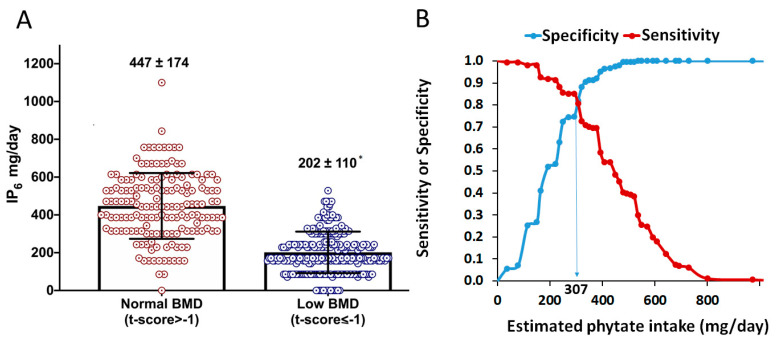
Figure 3.
Phytate intake and BMD. (A) Estimated phytate intake for normal- and low-BMD groups. Values are expressed as mean ± SD. * p-value < 0.05 versus normal BMD calculated by t-test for independent samples. (B) Sensitivity (Se) and specificity (Sp) of estimated phytate intake (test variable) respecting to low-BMD (versus normal-BMD; state variable). The vertical line indicates the value that concurrently optimizes sensitivity (Se) and specificity (Sp), which corresponds to an estimated phytate intake lower than 307 mg/day (Se = 81.9%. Sp = 80.7%. Youden Index = 0.626).

