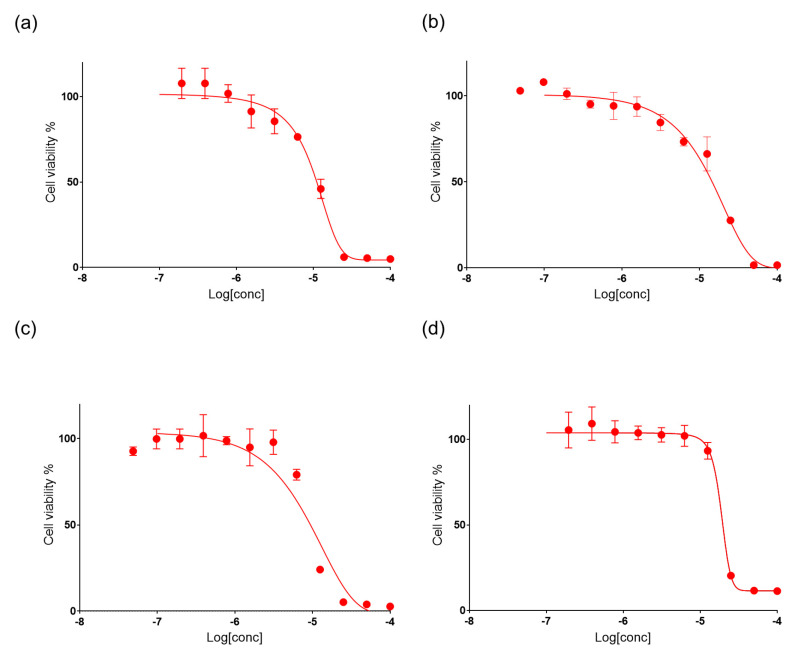
Figure 3.
Cell viability assay. The figure shows the anti-proliferative effects of mycalols (red line) on A549 (a), A2058 (b), HepG2 (c), and MRC5 (d) cell lines, at increasing concentrations (0.05, 0.10, 0.19, 0.39, 0.78, 1.56, 3.12, 6.25, 12.5, 25, 50, 100 μM). Control cells were incubated with complete cell medium and DMSO. Results are expressed as percent survival after 72 h exposure.

