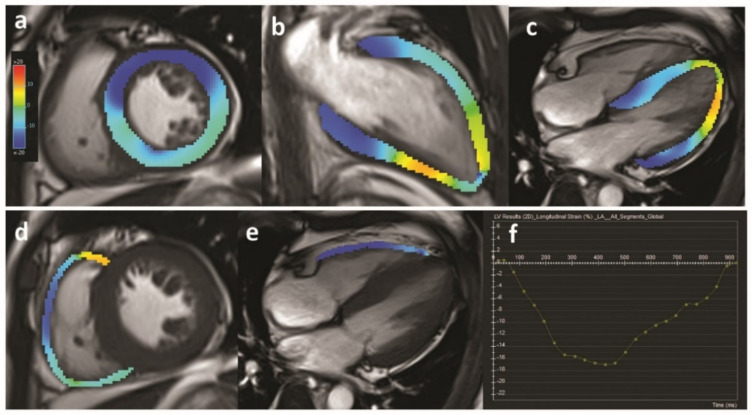
Figure 2.
Example of myocardial strain analysis using MRI in a patient with CKD. Quantification of left ventricular strain (a–c) and right ventricular strain (d,e) parameter is visualized by colored overlay on cine images. (f) is an example of strain–time curve of the left ventricular global longitudinal strain within one cardiac cycle.

