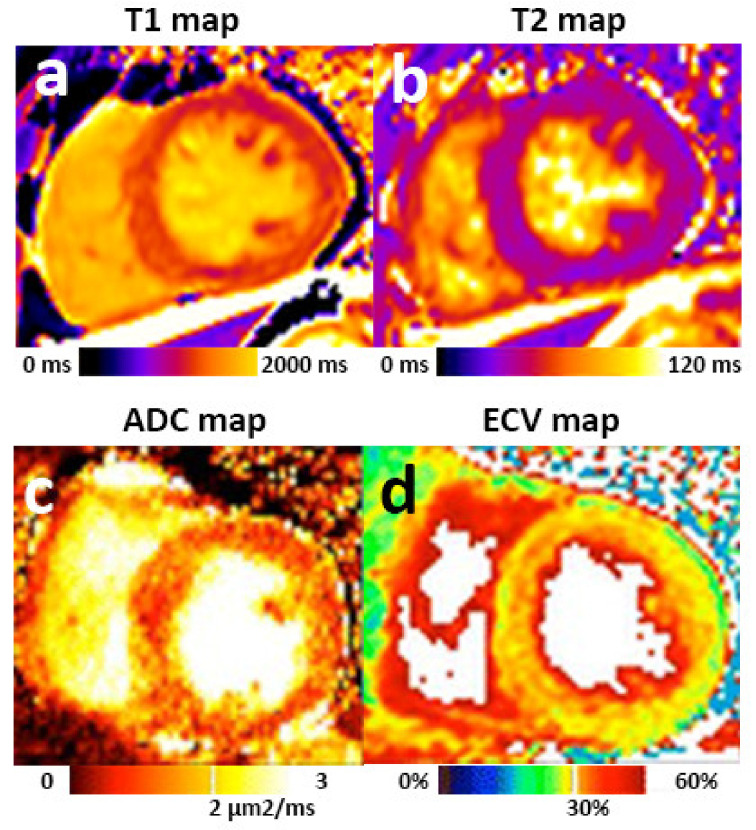
Figure 3.
Myocardial tissue characterization by multiparametric MRI. Mid-cavity short-axis T1 map (a) and T2 map (b) of a patient with CKD. Myocardial T1 and T2 values can be quantified and compared with local references. ADC (c) and ECV (d) images demonstrated diffused “pepper like” hyper intensity texture in a patient with hypertrophic cardiomyopathy. Images (c,d) were adapted from published article [52] under a Creative Commons license.

