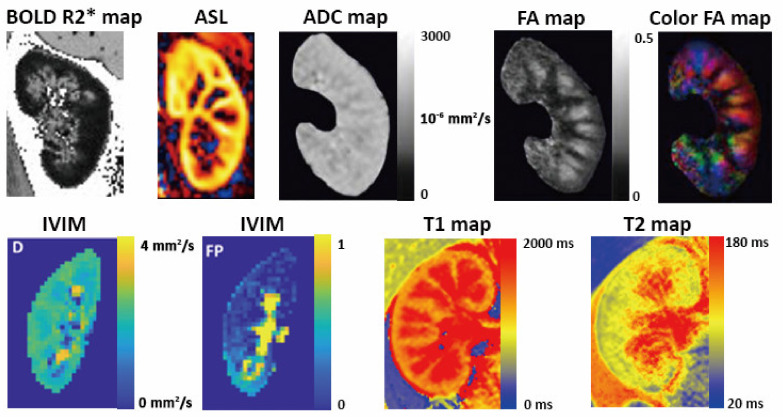
Figure 4.
Multiparametric kidney MRI in healthy volunteers. BOLD R2* map is used to evaluate parenchyma oxygenation. Renal blood flow can be quantified from ASL perfusion weighted image. ADC and FA maps generated from DWI and DTI can be used to assess renal fibrosis. IVIM imaging evaluates true parenchyma diffusion by separate modeling. Renal T1 maps showing clear cortico-medullary differentiation in a healthy volunteer and T2 mapping are promising techniques to evaluate renal microstructure. The BOLD R2* map, ADC map, FA maps and IVIM images were adapted from the articles of Bane et al. [71], Adams et al. [76], and de Boer et al. [77] under Creative Commons licenses.

