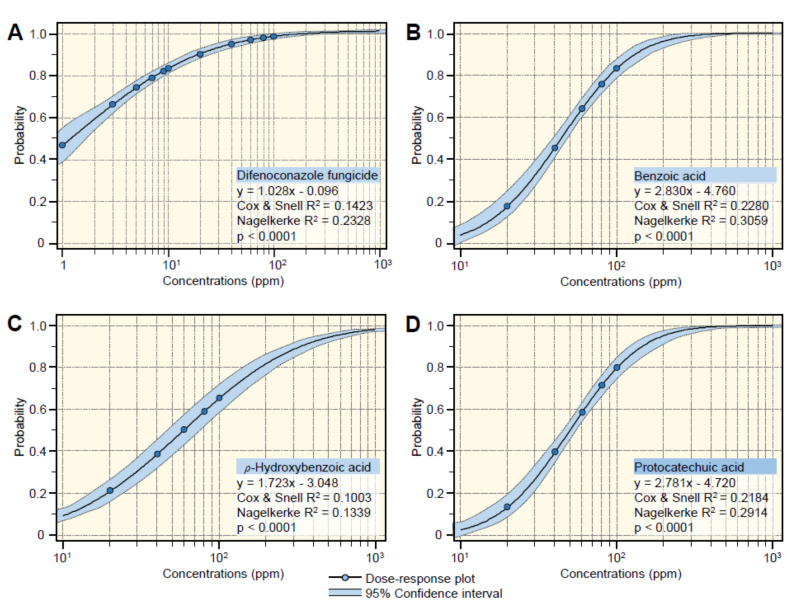
Figure 3.
Probit regression analysis of the inhibition effects of benzoic acid (BA) and its hydroxylated derivatives (ρ-hydroxybenzoic acid and protocatechuic acid) against Alternaria solani. (A) The positive control (difenoconazole fungicide), (B) benzoic acid, (C) ρ-hydroxybenzoic acid, and (D) protocatechuic acid. Blue dots present the mean of six replicates (n = 6). The dose-response regression lines are presented as black solid lines. The 95% CI (confidence intervals) for the estimated regression are light-blue-shaded and edged with dotted lines. Regression equations, Cox, and Snell R2, Nagelkerke R2, and p-value based on the F test (p < 0.05) were also obtained and presented within the graphs. The experiment was repeated twice with similar results.

