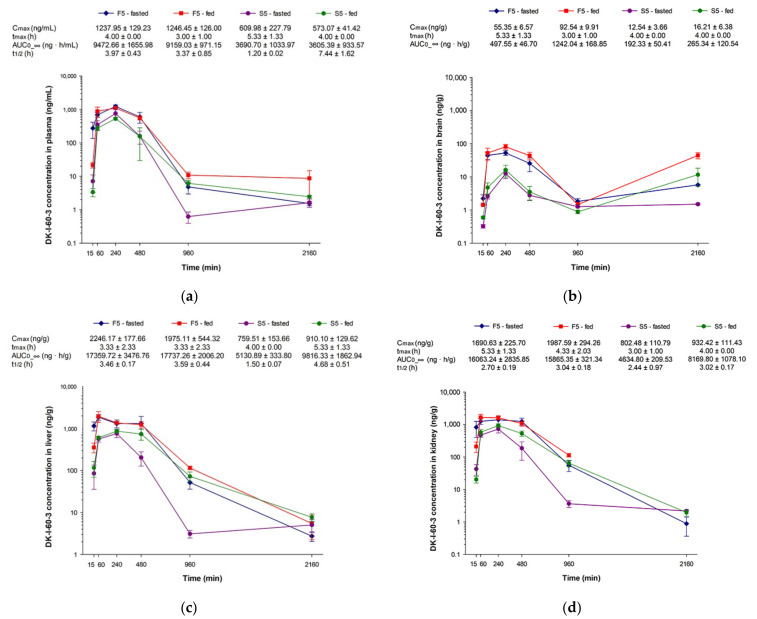
Figure 7.
Concentration versus time curves and calculated pharmacokinetic parameters of nanocrystal dispersion (F5) and suspension (S5) in (a) plasma, (b) brain, (c) liver, and (d) kidney after oral administration in rats (n = 3 per time point) at a dose of 10 mg/kg, in fasted and fed state (Cmax—maximum concentration, tmax—time of maximum concentration, t1/2—terminal elimination half-life, AUC0-∞—area under the concentration versus time curve). Terminal elimination half-life in the brain was not calculated due to erratic concentration-time profiles.

