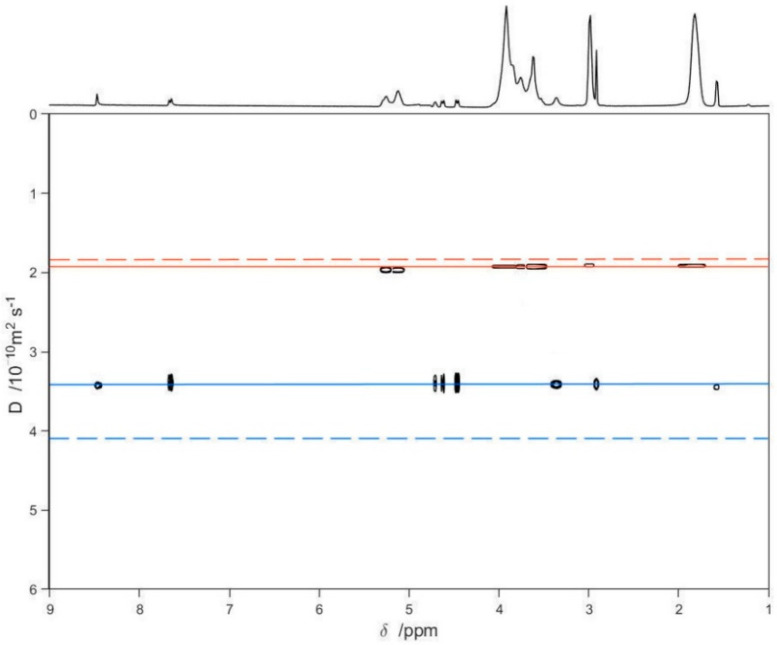
Figure 5.
2D DOSY-NMR measurements on the 10 mM D2O solutions of LVF, SBE-β-CD, and LVF/SBE-β-CD 1:1 inclusion complex. The horizontal axis represents the chemical shifts, whereas the vertical axis the diffusion coefficients; the black spots are the resonances of the aqueous solution of the inclusion complex spread in the second dimension according to their measured diffusion coefficient.

