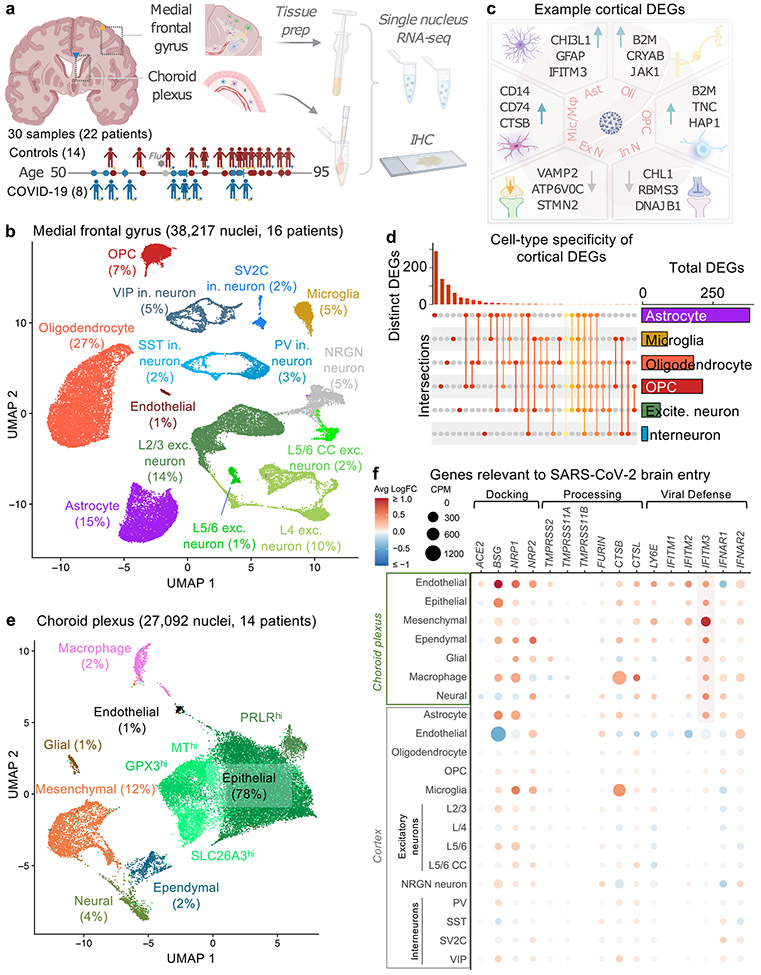
Fig. 1 ∣. Overview of diverse brain and choroid plexus cell types captured from post-mortem tissue from patients with COVID-19.
a, Study design. Coloured triangles denote the brain regions that were studied for each patient. IHC, immunohistochemistry. b, Uniform manifold approximation and projection (UMAP) of 38,217 nuclei from the medial frontal cortex of 8 control individuals (including 1 patient with influenza) and 8 patients with COVID-19. As in previous reports5,25,46, the ‘endothelial’ cluster also exhibits vascular mural cell markers and perivascular cells (perivascular fibroblast-like cells and perivascular macrophages) are not efficiently captured. exc., excitatory; in., inhibitory; OPC, oligodendrocyte precursor cell. c, Examples of DEGs in COVID-19 (n = 7 control individuals (without viral infection); n = 8 patients with COVID-19; MAST with default settings): excitatory neurons (exc. n.), inhibitory neurons (in. n.), astrocytes (ast.), oligodendrocytes (oli.), OPCs, and microglia and macrophages (mic./mac.). DEGs defined as log-transformed fold change > 0.25 (absolute value) and adjusted P value < 0.05 (Bonferroni correction). d, Cell-type specificity of cortical DEGs. UpSet plot showing a matrix layout of DEGs shared across and specific to each cell type. Each matrix column represents either DEGs specific to a cell type (single circle with no vertical lines) or DEGs shared between cell types, with the vertical line indicating the cell types that share that given DEG. Top, bar graph displays the number of DEGs in each combination of cell types. Right, bar graph displays the total number of DEGs for a given cell type. e, UMAP of 27,092 nuclei from the lateral choroid plexus of 14 individuals (n = 7 control individuals (including 1 patient with influenza); n = 7 patients with COVID-19; MAST with default settings). f, Expression profiles (counts per million reads mapped (CPM)) (circle size) and differential expression in patients with COVID-19 (average log-transformed fold change (avg log FC)) (colour) for genes relevant to SARS-CoV-2 entry into the brain16. The highlighted region indicates the consistent upregulation of the antiviral defence gene IFITM3 in choroid and glia limitans brain-barrier cells.

