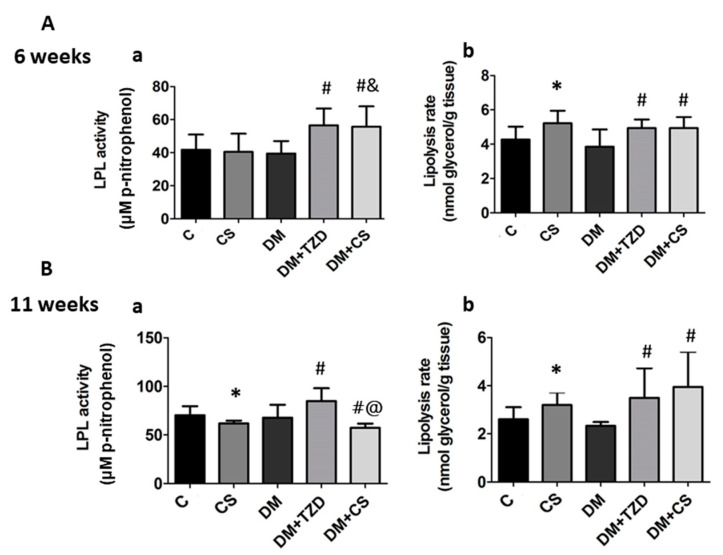
Figure 5.
Effects of chitosan on LPL activity and lipolysis rate in the perirenal adipose tissue of diabetic rats with different feeding durations. (A) 6-week feeding duration; (B) 11-week feeding duration. (a) LPL activity; (b) lipolysis rate. Results are expressed as mean ± S.D. for each group (n = 8). Significant differences (p < 0.05) analyzed by one-way ANOVA and two-tailed Student’s t-test. *: versus C; #: versus DM; &: versus CS; @: versus DM + TZD.

