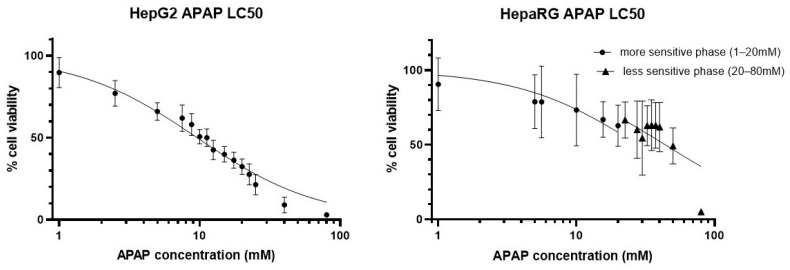
Figure A1.
Cell viability of monolayer cultured HepG2 (left) and differentiated HepaRG (right) cells after 24 h of acetaminophen exposure measured by the MTT-assay. Data points are normalized to untreated, and each data point represents the average ± SD of at least three independent experiments. Logistic curves were fitted using Graph Pad Prism 8 software.

