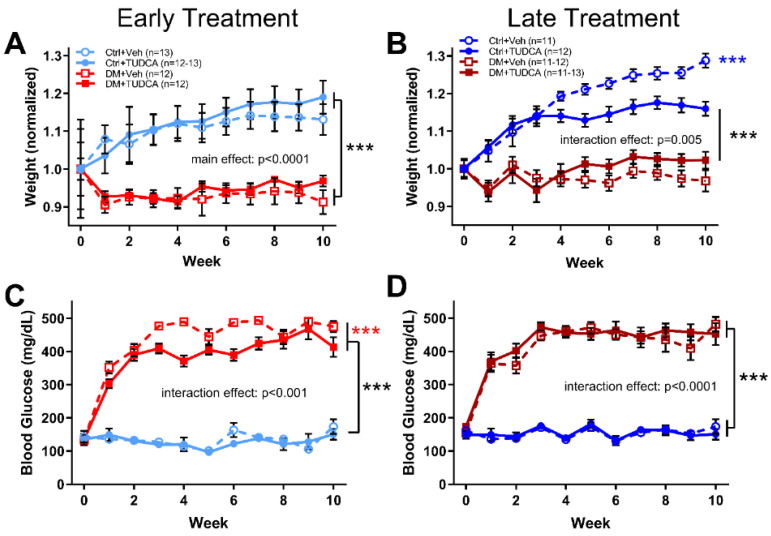
Figure 1.
Effects of DM and TUDCA treatment on body weight and blood glucose. (A) Early treatment body weight, normalized to mean baseline (0 week timepoint) weight by group. As animals aged, the Ctrl groups weighed significantly more than the DM groups (two-way ANOVA, F3,506 = 1.831, main effect p < 0.0001). (B) Late treatment body weight, normalized to baseline by group at 0-week timepoint. Again, the DM groups weighed significantly less than the Ctrl groups. However, the Ctrl + TUDCA group also weighed less than the Ctrl+Veh group (*** p < 0.0001) (two-way ANOVA, F30,484 = 4.330, interaction effect p < 0.0001). (C) In the early treatment experiment, blood glucose levels were significantly higher in both DM groups compared to Ctrl groups (two-way ANOVA, F30,506 = 15.19, interaction effect p < 0.0001). In addition, the DM+TUDCA group had significantly lower blood glucose than the DM+Veh group (*** p < 0.0001). (D) In the late treatment experiments, blood glucose in the DM groups was significantly higher than the Ctrl groups (two-way ANOVA, F30,484 = 7.604, interaction effect p < 0.0001). Holm–Sidak post hoc comparisons indicated by asterisks.

