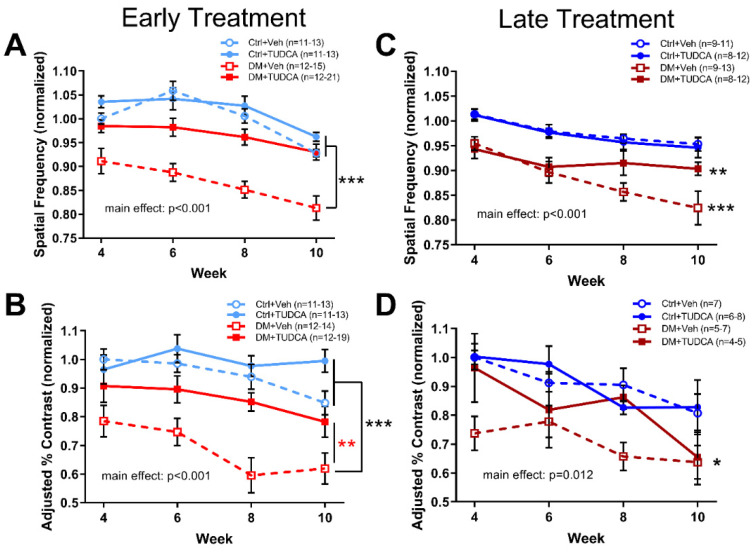
Figure 2.
Early TUDCA treatment preserves visual function in diabetic mice. All groups were assessed for spatial frequency and contrast sensitivity thresholds at 4, 6, 8 and 10 weeks following induction of hyperglycemia with values normalized to Ctrl+Veh at 4 weeks. (A) In the early treatment experiment, spatial frequency thresholds for Ctrl+Veh, Ctrl+TUDCA, and DM+TUDCA groups were similar, and were significantly higher than those of the DM+Veh group (two-way repeated measures ANOVA, F3,212 = 37.94, main effect of treatment p < 0.001). (B) In the late treatment experiment, spatial frequency thresholds for Ctrl+Veh and Ctrl+TUDCA groups were similar and significantly higher than those of DM+Veh (*** p < 0.001) and DM+TUDCA groups (** p = 0.008) (two-way repeated measures ANOVA, F3,170=17.58, main effect of treatment p < 0.001). (C) In the early treatment experiment, contrast sensitivity thresholds for Ctrl+Veh and Ctrl+TUDCA groups were similar and both were significantly higher than the DM+Veh group (two-way repeated measures ANOVA, F3,207 = 16.07, main effect of treatment, p < 0.001). The DM+TUDCA group also significantly differed from DM+Veh (** p = 0.004). (D) In the late treatment experiment, contrast sensitivity thresholds for the Ctrl+Veh group were significantly higher than those of the DM+Veh group (* p = 0.026; two-way repeated measures ANOVA, F3,95 = 4.42, main effect p = 0.012). Holm–Sidak post hoc comparisons indicated by asterisks.

